Difference between revisions of "Menu:Windows"
| (89 intermediate revisions by 4 users not shown) | |||
| Line 2: | Line 2: | ||
<!-- Adopted to Stylesheet DL6RAI --> | <!-- Adopted to Stylesheet DL6RAI --> | ||
| − | Most of the windows have a context menu which can be opened by right-clicking | + | Most of the windows have a context or "pop-up" menu which can be opened by right-clicking on the window. |
| − | All windows (except the | + | All windows can be moved by "dragging" the title bar with the mouse pointer. Simply hold down the left mouse button while the cursor is over the title bar, and drag the window with the mouse. Another option is to hold down the '''<tt>Ctrl</tt>''' key and the left mouse button while the mouse pointer is positioned anywhere within a window (except for the RTTY reception windows), then drag. |
| + | |||
| + | {{wbox|Tip|Hold down the '''<tt>Shift</tt>''' key while dragging or resizing a window to "snap" it into position, right next to the edge of an adjacent window.}} | ||
| + | |||
| + | ==Log Entry (Main window)== | ||
| + | [[Image:LogEntryWindow.PNG|frame|center|The Win-Test main logging window.]] | ||
| + | |||
| + | Use the Win-Test main window or "Log Entry" window to enter all QSOs made on the primary radio. The window displays the last nine QSOs in the log, plus a tenth line for entering the next QSO. The title bar displays the current log file name, the station name entered in the [[New_Log#Step_2:_Setup_your_log|Contest Configuration window]] (e.g. "[Shack]"), and the current operator's callsign (for multi-ops that use the '''<tt>OPON</tt>''' or '''<tt>LOGIN</tt>''' [[Text_commands#Multi_Operating|text commands]]). By default, the Win-Test main window serves as a background for all other windows, but you may also choose to have every window "float" independently (see [[Menu:Options#Windows]]). | ||
| + | |||
| + | When you close the log entry window, Win-Test terminates. | ||
| + | |||
| + | Any QSO may be edited simply by typing over anything that needs correction. Use the '''<tt>[Up arrow]</tt>''' and '''<tt>[Down arrow]</tt>''' keys to edit previous QSOs. To restore the original QSO data, press '''<tt>Ctrl-Z</tt>''' before moving the cursor from that line. You can also delete a QSO (if single-op), though it is usually better to just enter a duplicate QSO -- see [[Menu:Edit#Delete_QSO]] for more information. | ||
| + | |||
| + | When the cursor is positioned in the callsign field, data is entered in "insert mode", that is, typing does not replace characters, it only inserts them. In all other fields, data is entered in "overtype mode". See [[FAQ:User_Interface#Can_I_use_.22Insert_Mode.22_in_a_serial_number_or_exchange_field.3F|this entry in the FAQ]] for the rationale. | ||
| + | |||
| + | The '''<tt>[Spacebar]</tt>''' key is used to quickly move the cursor back and forth between the callsign field and the received exchange field, skipping over the RST columns. | ||
| + | |||
| + | {{wbox|Tip|Enter a "?" character in the middle of a callsign or exchange as a placeholder for missing information, e.g. <code>F?MZN</code>. Then when you press '''<tt>[Spacebar]</tt>''', the cursor will jump directly to the "?" character, and you can overtype it with the missing data (even in the callsign field).}} | ||
| + | |||
| + | The '''<tt>[Backspace]</tt>''', '''<tt>[Del]</tt>''', '''<tt>[Left arrow]</tt>''', '''<tt>[Right arrow]</tt>''', '''<tt>[Home]</tt>''', '''<tt>[End]</tt>''', '''<tt>[Ctrl][Left arrow]</tt>''' and '''<tt>[Ctrl][Right arrow]</tt>'''keys operate conventionally, within a single field; they do not move the cursor outside of the current field. | ||
| + | |||
| + | The '''<tt>[Tab]</tt>''' key may be used to position the cursor under the RST sent column as well as callsign and exchange. The '''<tt>[>]</tt>''' and '''<tt>[<]</tt>''' keys work similarly, but they also allow you to move the cursor to the QSO time field for direct editing. You can also change the time, date, frequency, serial number sent and other fields of a QSO by positioning the cursor on any line and pressing '''<tt>[Alt-F]</tt>''' to display the [[Menu:Edit|Edit QSO pop-up menu]]. | ||
| + | |||
| + | You may scroll back through the entire log by pressing the '''<tt>[PageUp]</tt>''' and '''<tt>[PageDown]</tt>''' keys. | ||
| + | |||
| + | {{wbox|Tip|Press '''<tt>Ctrl-[PageUp]</tt>''' to scroll back in the log by 24 hours.}} | ||
| + | |||
| + | Enter a '''QSO number''' on the last line and press '''<tt>[Ctrl-g]</tt>''' to "Go to" that QSO number in the log. Press '''<tt>[Ctrl-g] [Enter]</tt>''' to return to the bottom of the log. | ||
| + | |||
| + | Enter a callsign, prefix or '''beam heading''' (0 to 360°) on the last line and press '''<tt>[Ctrl]+[F12]</tt>''' to rotate to that heading. Press '''<tt>[Alt]+[F12]</tt>''' for long (or "alternate") path. For more information, see [[Rotators#Testing_the_configuration|Rotators]]. | ||
| + | |||
| + | Many other keys may be used in this window to assist with rapid data entry. For example, '''<tt>[F11]</tt>''' clears the entire QSO, whereas '''<tt>Ctrl-W</tt>''' clears only the current field. See [[Keys#Editing_and_moving_around_the_QSO_entry_line|Keys - Editing and moving around the QSO entry line]]. | ||
| + | |||
| + | The font size, background color, and header line attributes of this window may be adjusted by right clicking and selecting the '''Log''' option (see [[Menu:Options#Log]]). The yellow header text can be centered, left-justified, or completely hidden. | ||
| + | |||
| + | The columns vary from contest to contest. In the CQ World-Wide example above, | ||
| + | |||
| + | * '''QSO''' - raw QSO number. Can be hidden using [[Menu:Options#Hide_QSO_numbers|Hide QSO numbers]] (recommended for Multi-Multi contests with a sent serial number) | ||
| + | * '''Bd''' - band. Can be changed with '''<tt>[Alt-F1]</tt>''', '''<tt>[Alt-F2]</tt>''', or '''<tt>[Alt-F]</tt>''' | ||
| + | * '''Time''' - QSO time (UTC). Can be changed by moving the cursor with the '''<tt>[<]</tt>''' key, or '''<tt>[Alt-F]</tt>''' | ||
| + | * '''Callsign''' - Callsign of station worked. | ||
| + | {{wbox|Tip|Enter Win-Test [[Text_commands#List_of_Text_Commands|text commands]] (menu shortcuts) in the callsign field.}} | ||
| + | * '''Sen/Rcvd''' - Sent and received exchanges | ||
| + | * '''Mult''' - multipliers and other information: | ||
| + | ** '''C''' - Country multiplier | ||
| + | ** '''Z''' - Zone multiplier | ||
| + | ** '''DUPE''' - Duplicate contact | ||
| + | ** '''????''' - Multiplier in received exchange field not recognized (e.g. unrecognized state or section abbreviation, zone number out of range) | ||
| + | ** '''////''' - Unrecognized country prefix | ||
| + | ** '''!!!!''' - Multiplier violation (non-mult worked by a Mult station in a Multi-single, band change violation, etc.) | ||
| + | ** <i>other</i> - Prefix, country, state, grid, etc. multiplier | ||
| + | * '''Pt''' - QSO points | ||
| + | * '''Stn''' - Station identifier (can be changed by pressing '''<tt>Alt-Y</tt>''' - see [[Keys#Multi_Operator]]) | ||
| + | **'''R1/R2''' - Run 1 or Run 2 (multi-two), or Radio 1 / Radio 2 (SO2R). | ||
| + | **'''R/M''' - Run or Mult (Multi-single) | ||
| + | **'''+''' (suffix) - Indicates QSO data entered by a support or [[Menu:Windows#Partner|partner station]] | ||
| + | |||
| + | Finally, a red information line at the bottom of the window displays additional information, such as | ||
| + | * '''* New zone *''' | ||
| + | * '''* New country *''' | ||
| + | * '''* Dupe with #1963 at 23:59Z 2008-11-30 (25) * ''' | ||
| + | * '''* Spotted by F5MZN * ''' | ||
| + | * Brief one-line packet cluster announcements of new multipliers | ||
==Worked Gridsquares== | ==Worked Gridsquares== | ||
| Line 15: | Line 77: | ||
If the [[Menu:Windows#DX-Cluster_Announcements|DX-Cluster Announcements]] window is opened and the gridsquare of a spot is known, passing the mouse over this spot will blink its location in this window. | If the [[Menu:Windows#DX-Cluster_Announcements|DX-Cluster Announcements]] window is opened and the gridsquare of a spot is known, passing the mouse over this spot will blink its location in this window. | ||
| − | + | Right click on the map to display the pop-up window: | |
| + | |||
| + | [[Image:GridSquareMapPopUp.PNG|center|frame|Gridsquare map pop-up window displayed by right-clicking on the map]] | ||
| + | |||
| + | * '''Copy the map''' copies the image to the Windows clipboard | ||
| + | * '''Actualize Information''' controls when the map will be updated: | ||
| + | ** Pressing the spacebar | ||
| + | ** Automatically | ||
| + | * '''Colorize worked gridsquares''' marks worked grid squares in gray | ||
| + | * '''Show QSO''' marks QSOs with a red dot | ||
| + | * '''Display the spots''' marks spotted stations with a green dot | ||
| + | * '''Show gridsquares''' draws the squares and the grid square lines | ||
| + | * '''Show fields only''' turns grid square outlines off | ||
| + | * '''Show caption''' displays the major grid square names (first two letters) | ||
| + | * '''Center map here''' lets you move the center of the map interactively. | ||
| + | |||
| + | {{wbox|Note|This option is available only if you have '''not''' selected "Always center on the operating QTH" in the Properties dialog (see below).}} | ||
| + | |||
| + | * '''Properties...''' allows you to modify several display parameters: | ||
| − | [[Image: | + | [[Image:GridSquareMapProperties.PNG|center|frame|Gridsquares Map Properties]] |
| + | |||
| + | The larger the scale, the bigger the map. | ||
==Worked Zones== | ==Worked Zones== | ||
| Line 47: | Line 129: | ||
If one DXCC country has been worked on a band (possibly a mode), this band will be displayed in blue, otherwise it remains in white. This window is resizable. | If one DXCC country has been worked on a band (possibly a mode), this band will be displayed in blue, otherwise it remains in white. This window is resizable. | ||
| − | A right click on this window allows to display the countries alphabetically sorted (within the same continent), or sorted by number of band/mode worked. More, to easily search for missing countries, the countries worked on all bands can be hidden (clean sweeps). | + | A right click on this window allows to display the countries alphabetically sorted (within the same continent), or sorted by number of band/mode worked. More, to easily search for missing countries, the countries worked on all bands can be hidden (clean sweeps). Also, countries never worked in the contest can be hidden. |
You can easily move to the next (or previous) bookmark - displayed on a yellow background by default - by holding the '''<tt>Shift</tt>''' key down, while rolling your mouse wheel. | You can easily move to the next (or previous) bookmark - displayed on a yellow background by default - by holding the '''<tt>Shift</tt>''' key down, while rolling your mouse wheel. | ||
| Line 68: | Line 150: | ||
Opens (or closes) the checking multipliers window. | Opens (or closes) the checking multipliers window. | ||
| − | [[Image:WindowsCheckCountry. | + | [[Image:WindowsCheckCountry.PNG|center|frame|Check Multipliers window for the CQ World-Wide DX contest]] |
| − | The | + | To use this window, enter a callsign or country prefix in the data entry area of the main logging window. The dark blue line indicates the current band. The other lines indicate whether this multiplier has been worked or not on other bands (and in other modes if the contest rules permit). If the callsign entered has been worked on other bands, Win-Test displays those QSOs. Otherwise, the callsign of the first station worked in that multiplier on that band is displayed, if any. For the CQ World-Wide DX contest, display priority is: same callsign, same country and same zone. An uppercase "Z" in the last column indicates that the zone and country have been worked on the indicated band. A lowercase "z" means the zone has been worked, but not the country. And of course a blank line indicates that both the zone and country are needed. See also the [[Menu:Windows#Search_for_Worked_Multipliers_or_Partial_QTH_Locators|Search for Worked Multipliers]] window. |
| − | + | Additional information about the multiplier is displayed at the bottom: | |
| − | * The official prefix and | + | * The official country prefix and country name |
| − | * | + | * A small icon indicating if it is local day, night, or sunrise/sunset time in that country |
| − | * | + | * The current local time in that country (suffixed by a lowercase "l") |
| + | * The short (Az) and long path (Lp) beam headings (azimuths) to this multiplier (based on the station locator entered in the [[New_Log#Step_2:_Setup_your_logcontest|Contest configuration screen]]) | ||
| + | * The sunrise (SR) and sunset (SS) time in this country, expressed as UTC (suffixed by a lowercase "z"). These times are computed from the geographical coordinates given taken from the CTY* file or your QTH locator, if specified in the setup dialog. | ||
| + | * Graphical indication of the sun status on both sides of the QSO (may be disabled via the context menu) | ||
| + | ** Two yellow bars represent the sun over 24 hours of the day. The top bar displays the situation at the DX location, while the bottom bar represents your own location. | ||
| + | ** A pink cursor denotes current time. | ||
| + | ** Dotted lines represent local noon or local midnight. | ||
| − | A double click on a line will move the cursor to the specified QSO. | + | A double click on a line will move the cursor to the specified QSO. Press '''<tt>[Ctrl-End]</tt>''' or '''<tt>[Ctrl-G]</tt>''', '''<tt>[Enter]</tt>''' to return the cursor to the blank line at the end of the data entry area. |
| − | + | Finally, using the context menu (right click on the window), you can change '''Actualize information''' to '''Automatically''' (recommended) or to '''Pressing the space bar''' to indicate when you want the check multiplier screen to be updated. "Automatically" updates the screen after each keystroke. Any modification in the received exchange field (e.g. zone) also updates this check multiplier window. | |
| − | ==Search for Worked Multipliers== | + | ==Search for Worked Multipliers or Partial QTH Locators== |
| − | <code>Windows | Search for Worked Multipliers</code> | + | <code>Windows | Search for Worked Multipliers</code><br> |
| + | Keyboard shortcut: '''<tt>Shift+F10</tt>''' | ||
<br> | <br> | ||
| − | + | Lists all the callsigns logged in a specified multiplier (Zone, State, ARRL Section, Grid Square Locator, etc.). | |
| − | To quickly | + | To quickly list everyone you have logged in a particular multiplier, sorted by band, enter the multiplier in the ''callsign'' field and press '''<tt>Shift+F10</tt>'''. The [[Menu:Windows#Check_Partials|Check Partial Window]] will be displayed in a different format, as shown below. |
[[Image:WindowsCheckMult1.gif|center|frame|Looking for a departement during the REF HF Contest]] | [[Image:WindowsCheckMult1.gif|center|frame|Looking for a departement during the REF HF Contest]] | ||
| Line 95: | Line 184: | ||
[[Image:WindowsCheckMult3.gif|center|frame|Looking for an US state during the ARRL DX Contest (here: District of Columbia, DC)]] | [[Image:WindowsCheckMult3.gif|center|frame|Looking for an US state during the ARRL DX Contest (here: District of Columbia, DC)]] | ||
| + | |||
| + | Any further typing in the callsign field restores the [[Menu:Windows#Check_Partials|Check Partial Window]] to its normal appearance. You can also use '''<tt>[Ctrl-W]</tt>''', '''<tt>[Alt-W]</tt>''', or '''<tt>[F11]</tt>''' to erase the multiplier from the callsign field. | ||
| + | |||
| + | {{wbox|Note|This search only works for contests where the multiplier is logged as part of the exchange, so it doesn't work for the CQ WPX contest or the ARRL DX Contest (when operating from the U.S. and Canada).}} | ||
| + | |||
| + | For VHF/UHF/SHF... contests, this function is dedicated to partial QTH locator search. Enter the partial QTH locator either in the callsign or in the locator field and then press '''<tt>Shift-F10</tt>'''. | ||
| + | |||
| + | [[Image:WindowsCheckPartialQTHLocator.PNG|center|frame|Searching callsigns by QTH locator]] | ||
==Check Partials== | ==Check Partials== | ||
| Line 100: | Line 197: | ||
<br> | <br> | ||
| − | Opens (or closes) the | + | Opens (or closes) the Check Partials window. The master file used is normally MASTER.SCP or DEFAULT.SCP or ''contest''.DTB, as described under [[Check_Partial_and_Np1_Files|Check Partial and Np1 Files]]. |
| − | [[Image:WindowsCheckPartial.gif|center|frame|Checking partials | + | [[Image:WindowsCheckPartial.gif|center|frame|Checking partials. Partial callsign entered: A2Q]] |
| − | If this window is | + | If this window is open, and at least 3 characters are entered in the callsign logging field, Win-Test looks in the master database for the callsigns including the 3-character string. |
| − | For example, in this upper screen-shot, the | + | For example, in this upper screen-shot, the partial callsign entered is "A2Q". All the callsigns found by Win-Test show this string. |
| − | The white callsigns are those not worked yet. The green callsigns | + | The white callsigns are those not worked yet. The green callsigns are stations worked on another band, but not the current band. The red callsigns are the dupes (callsigns already worked on the current band). |
[[Image:WindowsCheckPartialOptions.gif|center|frame|Available context menu options in the Check Partial window]] | [[Image:WindowsCheckPartialOptions.gif|center|frame|Available context menu options in the Check Partial window]] | ||
| − | + | Double clicking on a callsign copies it into the callsign logging field. | |
| − | + | Right click in the window to brings up a context menu where you can choose if Win-Test is to use the master database or just your log. Another option is (in some contests) if you want to see the expected report in that window (from ''contest''.DTB). | |
| − | + | ||
| + | For slow contests, it might make sense to start the check partial search after the second letter is entered into the callsign field, rather than the third. | ||
Another option allows you limit the number of callsigns displayed to fit the available space in the window. | Another option allows you limit the number of callsigns displayed to fit the available space in the window. | ||
| − | Finally, the option | + | Finally, the option '''Used files list''' will display the master file that Win-Test has loaded to feed the Check Partials window: |
| + | |||
| + | [[Image:Check Partial Files List.PNG|center|frame|Used files list selected from Check Partial window pop-up menu]]. | ||
| + | |||
| + | See [[Check_Partial_and_Np1_Files|Check Partial and Np1 Files]] for more info about naming super check files, search order, and how to update them. | ||
| + | |||
| + | In HF contests such as CQ World-Wide, you can enter a zone number in the '''callsign''' field and press '''<tt>Shift+F10</tt>''' to display a list of prefixes in that zone, and a list of stations worked in that zone. | ||
| + | |||
| + | [[Image:WindowsCheckPartialShiftF10.png|center|frame|Check partial window after entering 37 in the callsign field and pressing Shift+F10 to view countries in that zone. 5H3EE is in zone 37 and has been worked on 20m.]] | ||
| + | |||
| + | In VHF/UHF contests, pressing '''<tt>Shift+F10</tt>''' on a partial QTH locator changes the Check Partials Window to the Partial QTH Locator Search Window. This feature is helpful to identify stations in a VHF/UHF contest when you copy only the QTH locator. | ||
| + | |||
| + | [[Image:WindowsCheckPartialResult.png|center|frame|Check Partial QTH Locator window]] | ||
| + | |||
| + | You may enter the partial QTH locator either in the callsign or in the QTH locator fields. A minimum of four characters has to be present in order to check the locator. | ||
==Check N + 1== | ==Check N + 1== | ||
| Line 125: | Line 237: | ||
<br> | <br> | ||
| − | Opens (or closes) the N + 1 window. | + | Opens (or closes) the N + 1 window. The master file used is normally MASTER.SCP or DEFAULT.SCP or ''contest''.DTB, as described under [[Check_Partial_and_Np1_Files|Check Partial and Np1 Files]]. |
| − | If this window is | + | If this window is open, and at least 3 characters are entered in the callsign logging field, Win-Test looks in the master database for the callsigns differing from the partial callsign by one character. |
This command also detects 2-character swap (dyslexia), as well as one missing character. | This command also detects 2-character swap (dyslexia), as well as one missing character. | ||
| − | [[Image:WindowsNp1_1.gif|center|frame|N + 1 window ( | + | [[Image:WindowsNp1_1.gif|center|frame|N + 1 window (Partial call entered: W5TQ)]] |
| − | If the callsign is not included in the master database, and has not been worked yet, it is considered | + | If the callsign is not included in the master database, and has not been worked yet, it is considered a UNIQUE. Otherwise, it is displayed in the first position. |
| − | [[Image:WindowsNp1_2.gif|center|frame|N + 1 window ( | + | [[Image:WindowsNp1_2.gif|center|frame|N + 1 window (Partial call entered: K3OK)]] |
| − | The white callsigns are the stations not yet worked. The green ones are those worked on another band | + | The white callsigns are the stations not yet worked. The green ones are those worked on another band, but not the current band. The red callsigns are dupes. |
[[Image:WindowsNp1_3.gif|center|frame|Available context menu options in the N+1 window]] | [[Image:WindowsNp1_3.gif|center|frame|Available context menu options in the N+1 window]] | ||
| − | + | Double clicking on a callsign copies it into the callsign logging field. | |
| − | A right click in | + | A right click in the window brings up a context menu where you can choose to use the master database or just your log. A second option (in some contests) is if you want to see the expected report in that window (from ''contest''.DTB). You may also wish to limit the number of callsigns displayed to the available space in the N+1 window. Finally, the option "Used files list" will display the master file that Win-Test has loaded to feed the Check Partials window. |
==Partner== | ==Partner== | ||
| Line 162: | Line 274: | ||
You can also swap the callsign field with one of the entries by pressing '''<tt>Ctrl-1</tt>''', '''<tt>Ctrl-2</tt>'''...'''<tt>Ctrl-9</tt>'''. | You can also swap the callsign field with one of the entries by pressing '''<tt>Ctrl-1</tt>''', '''<tt>Ctrl-2</tt>'''...'''<tt>Ctrl-9</tt>'''. | ||
| − | [[Image:WindowsPartnerWindowRealtimefeature.PNG|left|frame|Partner Window | + | Using message variables on CW and RTTY you can now enter a QSO (with correction or not), grab another callsign from the Partner window, and send the new report in one keystroke, by using: |
| + | '''$CORRECT TU $CR NOW $GRABPARTNER $NEXT $F2''' (sends call if corrected before the TU) | ||
| + | for the '''<tt>[Plus]</tt>''' key, or | ||
| + | '''$CURRENT TU $CR NOW $GRABPARTNER $NEXT $F2''' (resends full call before the TU) | ||
| + | assuming '''<tt>$F2</tt>''' contains the report. | ||
| + | |||
| + | If you want to manually grab a callsign from the Partner window you can use: | ||
| + | '''$PREV TU NOW $LOGGED $F2''' | ||
| + | Then | ||
| + | # Use the '''<tt>[Enter]</tt>''' key to silently enter the current QSO | ||
| + | # Grab the next callsign from the Partner windownd (via double-click or Alt-''n'') | ||
| + | # Send the message above | ||
| + | |||
| + | [[Image:WindowsPartnerWindowRealtimefeature.PNG|left|frame|Partner Window Context Menu]] | ||
| + | [[Image:WindowsPartnerWindowProperties.PNG|right|frame|Partner Window Properties]] | ||
<br><p>When a QSO is logged locally or via the network it is checked against the contents of the partner window, and - if found - removed from the partner window as it is now obsolete.</p> | <br><p>When a QSO is logged locally or via the network it is checked against the contents of the partner window, and - if found - removed from the partner window as it is now obsolete.</p> | ||
If automatic exchange guessing is enabled, a callsign grabbed from the partner window will have the exchange window filled in and will update the check partials and N+1 windows. | If automatic exchange guessing is enabled, a callsign grabbed from the partner window will have the exchange window filled in and will update the check partials and N+1 windows. | ||
| − | Finally, the entire Partner window content can be cleared by using the appropriate context menu item or by pressing '''<tt>Alt-Backspace</tt>'''. | + | Finally, the entire Partner window content can be cleared by using the appropriate context menu item or by pressing '''<tt>Alt-Backspace</tt>'''. Individual entries can be removed via '''<tt>Ctrl-Doubleclick</tt>'''. |
Up to three support partners can be engaged. If you do not want the partner to be limited by band and mode, use the "No band/mode filtering" option in the context menu of the partner window. | Up to three support partners can be engaged. If you do not want the partner to be limited by band and mode, use the "No band/mode filtering" option in the context menu of the partner window. | ||
| Line 173: | Line 299: | ||
A '''real-time''' mode is available in the partner window's context menu. This allows the main operator to have a real-time view on what the partner(s) is(are) typing (character by character) so he(she) does not have to wait until they press '''<tt>Alt-Enter</tt>''' in this time-critical situation. For this to work, the supporting partner has to change his station type to "Support" (see section [[Menu:Commands#Station_Type]]), indicated by '''<tt>R+</tt>''' on the QSO entry line. | A '''real-time''' mode is available in the partner window's context menu. This allows the main operator to have a real-time view on what the partner(s) is(are) typing (character by character) so he(she) does not have to wait until they press '''<tt>Alt-Enter</tt>''' in this time-critical situation. For this to work, the supporting partner has to change his station type to "Support" (see section [[Menu:Commands#Station_Type]]), indicated by '''<tt>R+</tt>''' on the QSO entry line. | ||
| − | In the context menu of the partner window there are two | + | In the context menu of the partner window there are two settings that can be done, when more then one partner (up to 3) is engaged: |
* as support, must be selected to which slot this partner will send its real-time characters | * as support, must be selected to which slot this partner will send its real-time characters | ||
* as runner, must be selected how many slot are being displayed at the partner window top | * as runner, must be selected how many slot are being displayed at the partner window top | ||
| Line 184: | Line 310: | ||
Opens (or closes) the status window. | Opens (or closes) the status window. | ||
| − | [[Image:StatusWindow. | + | [[Image:StatusWindow.PNG|center|frame|Status Window]] |
This window indicates the status of each station connected to the network. From left to right, are displayed : | This window indicates the status of each station connected to the network. From left to right, are displayed : | ||
| Line 194: | Line 320: | ||
* Radio 1 frequency | * Radio 1 frequency | ||
* Radio 2 frequency | * Radio 2 frequency | ||
| + | * Operator | ||
* Time left before a possible QSY, according to the 10 minutes M/S rule, or "OK" if the station is allowed to make a QSY on another band. Note that this column only appears if the contest specifies this particular rule. | * Time left before a possible QSY, according to the 10 minutes M/S rule, or "OK" if the station is allowed to make a QSY on another band. Note that this column only appears if the contest specifies this particular rule. | ||
| Line 202: | Line 329: | ||
Opening the context menu with a right mouseclick will allow you to turn on network traffic logging. This might be useful for basic network troubleshooting. This log file uses the .ntk (stands for NeTworK) file extension. | Opening the context menu with a right mouseclick will allow you to turn on network traffic logging. This might be useful for basic network troubleshooting. This log file uses the .ntk (stands for NeTworK) file extension. | ||
| + | |||
| + | Ping a specific station from the context menu on this station name and use "Ping XXX". The Win-Test version, the Master, Bridgehead, Sync indicators and the propagation time are returned in the Gab window (Alt-I). Reminder: You may also use the INV (stands for Inventory) text command to get a summary of the complete network. | ||
| + | |||
| + | A remote command to a specific station can be sent by opening the context menu on this station name and use "Send remote command to XXX...". | ||
At last, a double left click on any frequency displayed will tune the current radio to that frequency. | At last, a double left click on any frequency displayed will tune the current radio to that frequency. | ||
| Line 212: | Line 343: | ||
[[Image:WindowsSked.gif|center|frame|Skeds Window]] | [[Image:WindowsSked.gif|center|frame|Skeds Window]] | ||
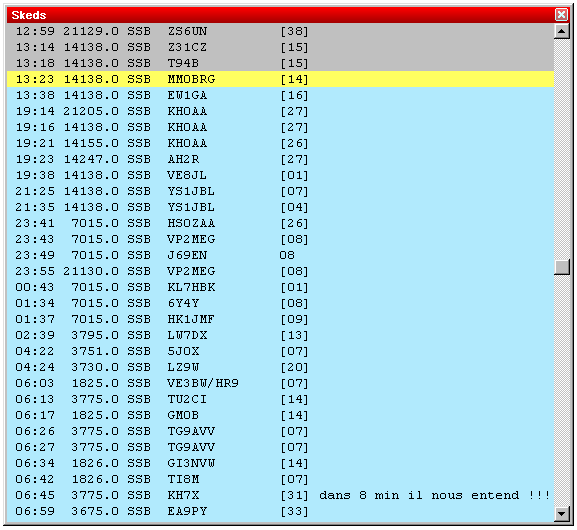
| − | + | Skeds (Alt-E) and passed stations (Alt-D) are displayed in this window. See [[Multi-op/Passing]]. | |
* A grey background means that the sked is over for more than 10 minutes. | * A grey background means that the sked is over for more than 10 minutes. | ||
| Line 246: | Line 377: | ||
<code>Windows | QSY Wizard</code> | <code>Windows | QSY Wizard</code> | ||
| − | The QSY Wizard can only be used if [[HamCAP]] is installed and running | + | The QSY Wizard can only be used if [[HamCAP]] is installed and running. You must also have [[Menu:Options#HamCAP| Options | HamCAP | Tab]] set to '''Charts'''. |
After working a DX, pressing '''<tt>Ctrl-P</tt>''' will bring up the HamCAP window with a propagation prediction to this DX. Then, the QSY Wizard will display the bands on which to which a QSY or sked may be useful: | After working a DX, pressing '''<tt>Ctrl-P</tt>''' will bring up the HamCAP window with a propagation prediction to this DX. Then, the QSY Wizard will display the bands on which to which a QSY or sked may be useful: | ||
| Line 263: | Line 394: | ||
===XDT Files=== | ===XDT Files=== | ||
| − | The first column is the callsign of the station for which information is to be displayed. The rest of the line carries the information to display. There can be only one | + | The first column is the callsign of the station for which information is to be displayed. The rest of the line carries the information to display. There can be only one line per callsign. Lines have to be formatted in MS-DOS mode, i.e. CR/LF at the end. |
You can set up to 10 default extra data files by the menu function '''<code>Options | Data files | Default data files</code>'''. These files will be opened with every log. They must be located in the WT installation directory. Refer to [[Menu:Options#Default_extra_data_files... | Menu: Options Default extra data files...]] for detailed information. | You can set up to 10 default extra data files by the menu function '''<code>Options | Data files | Default data files</code>'''. These files will be opened with every log. They must be located in the WT installation directory. Refer to [[Menu:Options#Default_extra_data_files... | Menu: Options Default extra data files...]] for detailed information. | ||
| Line 271: | Line 402: | ||
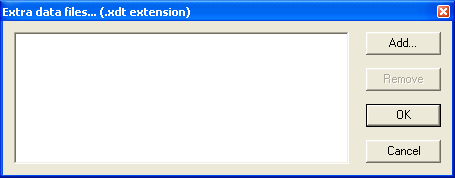
[[Image:LogSpecificExtraDataFiles.png|center|frame|Click the ADD button to locate and select the file you need]] | [[Image:LogSpecificExtraDataFiles.png|center|frame|Click the ADD button to locate and select the file you need]] | ||
| − | There is no limitation to the location and the number of these log-specific files. The added file names and paths will then be save in a file with '''<tt>.xdl</tt>''' extension among all the other contest specific files (.LOG, .SUM, .pkt, . | + | There is no limitation to the location and the number of these log-specific files. The added file names and paths will then be save in a file with '''<tt>.xdl</tt>''' extension among all the other contest specific files (.LOG, .SUM, .pkt, .gab, .wtb, etc.). |
If you modify an '''<tt>.XDT</tt>''' file while it is in use, you must reload it by using the '''<tt>Reload files</tt>''' item in the context menu. | If you modify an '''<tt>.XDT</tt>''' file while it is in use, you must reload it by using the '''<tt>Reload files</tt>''' item in the context menu. | ||
| − | + | {{wbox|Note|This function is designed to work with no more than a few thousand callsigns only. Don't try it with millions of lines or a Callbook file!}} | |
===Directives=== | ===Directives=== | ||
| Line 304: | Line 435: | ||
| − | + | {{wbox|Note|The variable subsitution only works with the internal CW keyer.}} | |
==Summary== | ==Summary== | ||
| Line 316: | Line 447: | ||
A right click allows to copy the scoring summary data in the clipboard as an image or as a text file (in WT language or in English, depending on the contest). | A right click allows to copy the scoring summary data in the clipboard as an image or as a text file (in WT language or in English, depending on the contest). | ||
| + | |||
| + | ===Live Score=== | ||
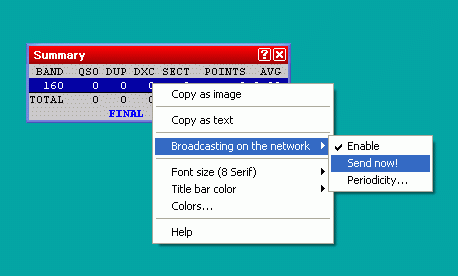
[[Image:LiveScoreBroadcasting.gif|center|frame|Enabling Live Score Broadcasting through the context menu]] | [[Image:LiveScoreBroadcasting.gif|center|frame|Enabling Live Score Broadcasting through the context menu]] | ||
| Line 322: | Line 455: | ||
needed to post your score to one of the live scoreboards on the internet. | needed to post your score to one of the live scoreboards on the internet. | ||
| − | For testing purposes, there is an option to create a live score broadcast "now"; typically, it will be broadcasted automatically once every five minutes or however you set up the periodicity. Live score broadcasting in a multi operator environment is limited to the station that is the network time master. For further information about live scores, please see [http://www. | + | For testing purposes, there is an option to create a live score broadcast "now"; typically, it will be broadcasted automatically once every five minutes or however you set up the periodicity. Live score broadcasting in a multi operator environment is limited to the station that is the network time master. |
| + | |||
| + | For further information about live scores, please see [http://www.5b4wn.com/main/index.php?m=10] and [https://dl1dxa.darc.de/pdf/wt4.pdf] (German language). | ||
==Rate== | ==Rate== | ||
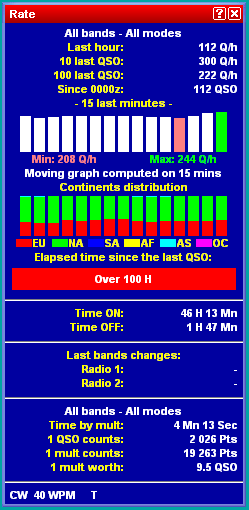
| − | <code>Windows | | + | <code>Windows | Rate</code> or '''<tt>Alt-R</tt>''' |
<br> | <br> | ||
Opens (or closes) the rate window. | Opens (or closes) the rate window. | ||
| Line 333: | Line 468: | ||
This window is divided in different parts: | This window is divided in different parts: | ||
| − | The upper part displays the rate of the last hour, of the last 10 QSO, and of the last 100 QSO. It also displays a moving graph of the rate, computed on the last 15 minutes before the current QSO. The lower portion of that window | + | The upper part displays the rate of the last hour, of the last 10 QSO, and of the last 100 QSO. It also displays a moving graph of the rate, computed on the last 15 minutes before the current QSO. The lower portion of that window displays additional rate information in text format. |
===Graphs=== | ===Graphs=== | ||
| Line 339: | Line 474: | ||
Below is a display that shows instant continent distribution of previous QSOs. It uses the same timing parameters as the instant rates above. | Below is a display that shows instant continent distribution of previous QSOs. It uses the same timing parameters as the instant rates above. | ||
| + | |||
| + | The QSO Timer Alarm progress bar appears below that. This bar gives a clear visual indication of the time elapsed since your last QSO. Right click and select '''Off-time timer alarm''' to set the full scale range of the progress bar. In the screen shot above, it is the red bar showing over 100H elapsed since the last QSO, but normally it is a green progress bar that advances from left to right. It begins as 100% green and slowly more of it turns red until it reaches full scale, when the bar becomes 100% red. The default scale is 5 minutes, but it is configurable between 1 and 120 minutes. | ||
===Text Information=== | ===Text Information=== | ||
| − | The next part | + | The next part displays information about Time ON and Time OFF. For new logs, the off-time calculation is based on the contest rules. You can still use a custom setting to check your operating efficiency. Right click and select '''Off-time calculation threshold'''. If the contest rule is unknown, 15 minutes will be used as a default threshold. |
| − | + | The next part shows information about band changes. | |
| − | |||
| − | The next part shows | ||
The central part gives general information about the point statistics of the contest, e.g. time by mult, QSO counts, Mult worth, etc. | The central part gives general information about the point statistics of the contest, e.g. time by mult, QSO counts, Mult worth, etc. | ||
| − | The | + | The bottom part indicates the current mode and, in CW, the current speed, as well as the status of the automated CQ repeat mode. |
| + | Some indicators that may appear there include: | ||
| + | * '''CW''' - Operating mode is set to CW (press '''<tt>Ctrl-F1</tt>''' or '''<tt>Ctrl-F2</tt>''' to change) | ||
| + | * '''SSB''' - Operating mode is set to Phone | ||
| + | * '''RTTY''' - Operating mode is set to RTTY | ||
| + | * '''34 WPM''' - CW speed in Words Per Minute (adjust with '''<tt>Alt-F9</tt>''', '''<tt>Alt-F10</tt>''', and '''<tt>Alt-V</tt>''') | ||
| + | * '''34/32 WPM''' - Independent CW speed between Win-Test and WinKey pot (WinKey speed displayed on right) | ||
| + | * '''S''' - Operator is listening in Stereo mode (operator pressed '''<tt>AltGr-S</tt>''' or '''<tt>Ctrl-Alt-S</tt>''', press '''<tt>AltGr-A</tt>''' or '''<tt>Ctrl-Alt-A</tt>''' to remove) | ||
| + | * '''T''' - Operator is listening to the Secondary Radio (operator pressed '''<tt>AltGr-T</tt>''' or '''<tt>Ctrl-Alt-T</tt>''', press '''<tt>AltGr-A</tt>''' or '''<tt>Ctrl-Alt-A</tt>''' to remove) | ||
| + | * '''REPEAT''' - Automatic repeating CQ feature is active and '''<tt>[F1]</tt>''' has been pressed. See [[Menu:Tools#Automatic_CQ_repeat|Automatic CQ Repeat]]. | ||
===Context Menu=== | ===Context Menu=== | ||
| Line 365: | Line 509: | ||
* Points / h : Including the multipliers | * Points / h : Including the multipliers | ||
| − | Moreover, the | + | Thresholds are defined and can be modified on the following properties: |
| + | |||
| + | * Instant moving graph window -how many minutes of history are taken into account | ||
| + | * Off Time Alarm - after how many minutes the color of the green bar will turn red | ||
| + | * Off-time calculation - after how much time of no QSO, time is counted towards off-time (may be contest specific) | ||
| + | * Last band change method - which event triggers the timer after a band change | ||
| + | |||
| + | Moreover, the contents of the rate window can be customized by selecting one or more of the following, which are listed under the '''Display''' menu item of the context menu: | ||
* Instant rate moving graph | * Instant rate moving graph | ||
| Line 376: | Line 527: | ||
* Distances Data | * Distances Data | ||
| − | Finally, | + | Finally, right click and select the '''Copy''' menu item to copy this window, as an image, to the Windows clipboard. |
| − | + | {{wbox|Note|The available menu items in the context menu may vary depending on where you right click in the window.}} | |
==Statistics== | ==Statistics== | ||
| − | <code>Windows | Statistics</code> or '''<tt> | + | <code>Windows | Statistics</code> or '''<tt>[Ctrl-F9]</tt>''' |
<br> | <br> | ||
| − | Opens (or closes) the rate sheet window. | + | Opens (or closes) the Statistics window, a rate sheet. |
| + | |||
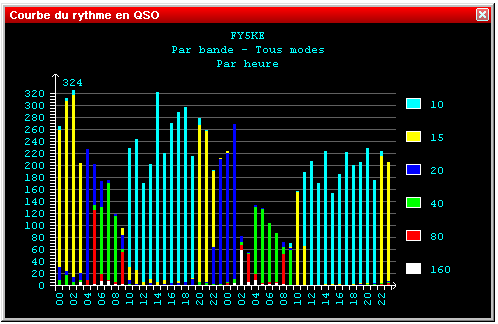
| + | [[Image:WindowsRateSheet.gif|center|frame|Statistics Window showing total QSOs made on all bands and modes, per hour]] | ||
| + | |||
| + | The size of this window can be changed by dragging the edges. The window displays the number of QSOs, hour by hour, for the entire contest period. | ||
| − | [[ | + | The time span is fixed depending on the contest type. For the shorter contests, the display spans 24 hours; for the major contests, it spans the full 48 hours. For DXpeditions, it is configurable from 1 to 15 days via the [Days...] button in the [[New_Log#Step_2:_Setup_your_log|Contest Configuration window]]. |
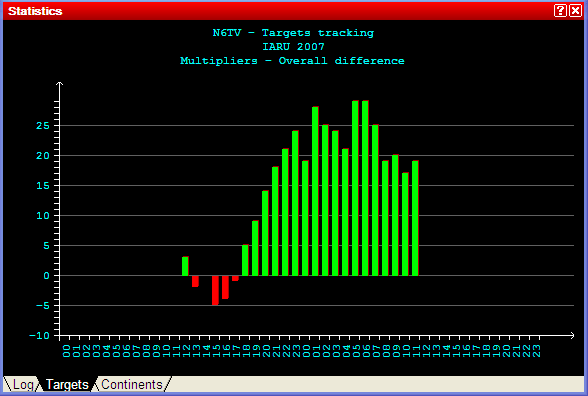
| − | + | Switching to the '''Targets''' tab in the statistics window, you may compare your current score to a pre-loaded estimate, which may be derived from a previous contest operation or generated by hand. Positive offsets with respect to the target file are shown in green color, negative offsets in red color. | |
| − | + | [[Image:Targets.PNG|center|frame|Cumulative (overall) Multiplier tracking vs. target]] | |
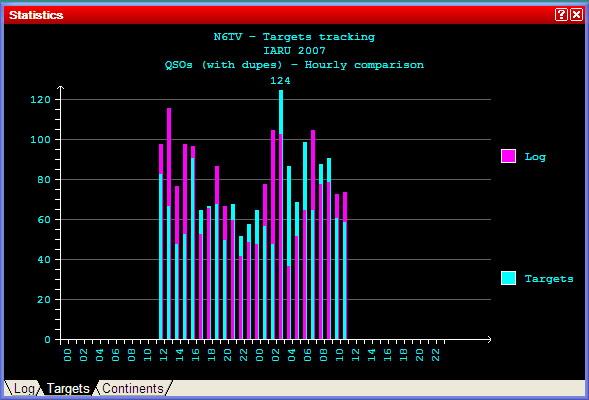
| − | + | You may also display hour-by-hour comparisons with the targets. | |
| − | [[Image: | + | [[Image:StatisticsHourlyQSOTargets.PNG|center|frame|Hour by hour QSO tracking vs. target]] |
| − | Please see | + | Please see [[Menu:Tools#Load_an_objective_file|Menu | Tools | Load a targets file...]] for further information on exporting and loading target files. |
| + | |||
| + | Switching to the '''Continents''' tab displays continental QSO statistics. | ||
| + | |||
| + | [[Image:StatisticsContinents.PNG|center|frame|Continental QSO statistics]] | ||
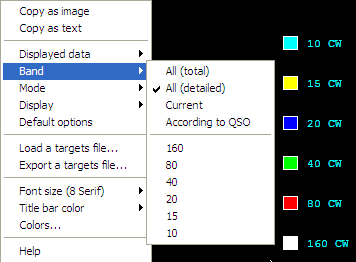
A right click allows to set different display options: | A right click allows to set different display options: | ||
| + | |||
| + | {| align="center" | ||
| + | |[[Image:StatisticsPopUpMenuDisplayedData.PNG|center|frame|Pop-up menu showing displayed data options]] | ||
| + | |[[Image:StatisticsPopUpMenu.PNG|center|frame|Pop-up menu showing band options]] | ||
| + | |} | ||
Displayed Data | Displayed Data | ||
| − | * Select which kind of data to display: QSOs, QSO | + | * Select which kind of data to display: QSOs, Multipliers, QSO Points, etc. |
| + | |||
Band | Band | ||
| − | * All (total): Single color display | + | * All (total): Single color display, all bands combined |
| − | * All (detailed): | + | * All (detailed): Multicolor display, one color per band |
| − | * Current: Displays | + | * Current: Displays statistics for the current band |
| − | * According to QSO: Displays | + | * According to QSO: Displays statistics for the band of the currently selected QSO |
Mode | Mode | ||
| − | * All (total): Single color display | + | * All (total): Single color display, all modes combined |
| − | * All (detailed): | + | * All (detailed): Multicolor display, one color per mode |
| − | * Current: Displays | + | * Current: Displays statistics for the current mode |
| − | * According to QSO: Displays | + | * According to QSO: Displays statistics for the mode of the currently selected QSO |
Display | Display | ||
| − | * By time: Displays | + | * By time: Displays an hour by hour comparison |
| − | * Overall: Displays | + | * Overall: Displays a cumulative (overall total) comparison |
| − | Another option allows you to | + | Another option allows you to load a targets file for comparison, or export a targets file based on the current log. |
| − | Finally, it is possible to copy | + | Finally, it is possible to copy any of the Statistics windows as image or text to the Windows clipboard. Then you can copy the data into to a text document or even into an Excel® or OpenOffice spreadsheet. |
==Gab== | ==Gab== | ||
| Line 440: | Line 605: | ||
A double-click in a station name in this window will open the chat dialog, with this station name as default destination. | A double-click in a station name in this window will open the chat dialog, with this station name as default destination. | ||
| + | |||
| + | If the gab window becomes too cluttered, you may wish to clear it via the context menu. | ||
==World Map== | ==World Map== | ||
| Line 472: | Line 639: | ||
While in split mode during 40m and 80m SSB operation, when adding a spot to the band map, Win-Test remembers both the RX and the TX VFO frequencies, and will store this information so that when you select the spot, both VFOs will be set correctly, and you'll be ready to call (unless the QSX frequency has changed in the mean time). | While in split mode during 40m and 80m SSB operation, when adding a spot to the band map, Win-Test remembers both the RX and the TX VFO frequencies, and will store this information so that when you select the spot, both VFOs will be set correctly, and you'll be ready to call (unless the QSX frequency has changed in the mean time). | ||
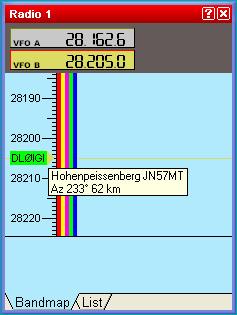
| − | Moving the mouse pointer over a spot in the band map will bring up additional information, such as the age of the spot the callsign of the spotter, and any comments. | + | Moving the mouse pointer over a spot in the band map will bring up additional information, such as the age of the spot the callsign of the spotter, and any comments. Double-clicking the spot with the '''<tt>[Ctrl]</tt>''' key removes the spot from the band map (without confirmation). |
[[Keys#Band_Map|Other key combinations]] can be used to operate with the Band Map. | [[Keys#Band_Map|Other key combinations]] can be used to operate with the Band Map. | ||
| Line 482: | Line 649: | ||
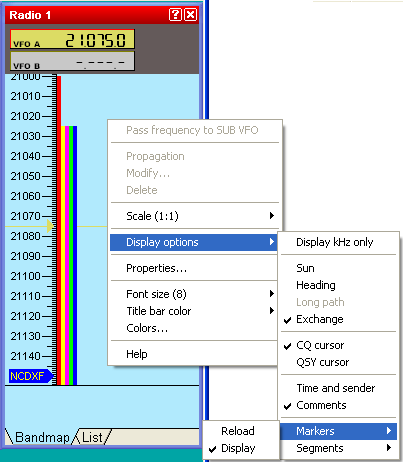
* The top option in this Context Menu allows you to program the Sub VFO (if your radio supports it) with this spot. | * The top option in this Context Menu allows you to program the Sub VFO (if your radio supports it) with this spot. | ||
* The '''Propagation''' submenu item allows you to gather propagation information via [[HamCAP]] (if installed) | * The '''Propagation''' submenu item allows you to gather propagation information via [[HamCAP]] (if installed) | ||
| − | * The next two entries '''Modify...''' and '''Delete''' allow you to change or remove spots in the band map. Note that you can quickly remove a spot by clicking it with the '''<tt>Ctrl</tt>''' key pressed. | + | * The next two entries '''Modify...''' and '''Delete''' allow you to change or remove spots in the band map. Note that you can quickly remove a spot by double-clicking it with the '''<tt>[Ctrl]</tt>''' key pressed. |
| − | * Additionally, you can change the scale of the band map display from 1:1 up to | + | * Additionally, you can change the scale of the band map display from 1:1 up to 30:1. The scale can also be set through the mouse wheel. |
* More options are hidden in the sub menus [[#Extended_information|Display Options]] and [[#Band_Map_properties|Properties...]] where one can set a lot of minor details of the band map. | * More options are hidden in the sub menus [[#Extended_information|Display Options]] and [[#Band_Map_properties|Properties...]] where one can set a lot of minor details of the band map. | ||
[[Image:WindowsBandMapContextMenu.PNG|center|frame|Band Map Context Menu]] <br> | [[Image:WindowsBandMapContextMenu.PNG|center|frame|Band Map Context Menu]] <br> | ||
| Line 584: | Line 751: | ||
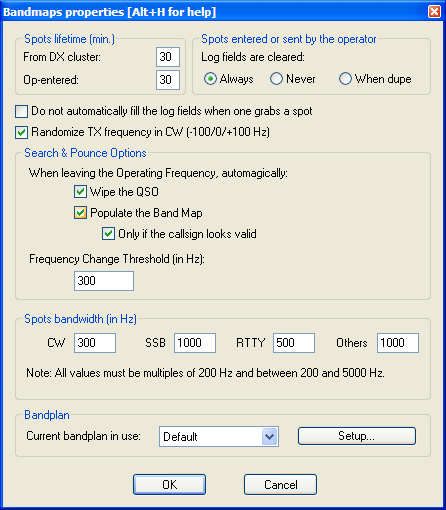
====Band Map properties==== | ====Band Map properties==== | ||
| − | Selecting 'Properties...' in the context menu | + | Selecting '''Properties...''' in the context menu of the Radio 1 or Radio 2 band map windows displays the Bandmaps Properties window: |
[[Image:BandMapProperties.png|center|frame|Bandmap properties window]] | [[Image:BandMapProperties.png|center|frame|Bandmap properties window]] | ||
| − | + | Here you can define the lifetime of two kinds of spots, control the behavior of the logging window when you press '''<tt>[Ctrl-Enter]</tt>''' to create an operator-entered spot, control the automatic entry of data in the logging window when you grab a spot in the bandmap (via double click), select random 100 Hz TX frequency offsets to improve the chances of calling a spot on a clearer frequency (recommended), and the spot bandwidth for each mode (CW, SSB, RTTY) which is used to determine when two spots are on the same frequency. The spot bandwidth can be set between 0 Hz and 5000 Hz, in 100 Hz steps. The lifetime of spots in the band map can be changed from the default (60 minutes) to any other value below 100 minutes. | |
| − | Search & Pounce Options allow you to add spots to the band map without having to press '''<tt>[Ctrl-Enter]</tt>'''. | + | Search & Pounce Options allow you to add spots to the band map without having to press '''<tt>[Ctrl-Enter]</tt>'''. Simply enter the callsign and turn the VFO by the specified frequency change threshold to automatically populate the band map. |
| − | + | {{wbox|Note|To automatically populate the Band Map, you must be in S&P mode. Search & Pounce is not activated by default. Select [[Menu:Tools#Enable_Run.2FS.26P_switching|Tools | Data entry | Enable Run/S&P switching]] (text command shortcut: '''<tt>RUNSP [Enter]</tt>'''), and then press '''<tt>[Ctrl-tab]</tt>''' once to toggle from Run to S&P mode. The [[Menu:Windows#Clock|clock window]] indicates the current mode.}} | |
==Secondary Radio== | ==Secondary Radio== | ||
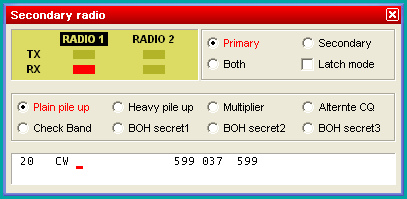
| Line 603: | Line 770: | ||
This window controls the "other" radio that is currently not in use during SO2R operation, not necessarily radio 2. | This window controls the "other" radio that is currently not in use during SO2R operation, not necessarily radio 2. | ||
For more information, please see [[SO2R/Second_radio_window]]. | For more information, please see [[SO2R/Second_radio_window]]. | ||
| + | |||
| + | ==RTTY (radio1, radio2)== | ||
| + | <code>Windows | RTTY (radio 1)<br> | ||
| + | Windows | RTTY (radio 2) | ||
| + | </code> | ||
| + | <br> | ||
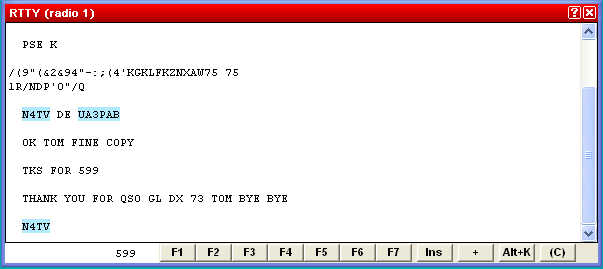
| + | Opens (or closes) the RTTY Transit/Receive windows. | ||
| + | |||
| + | [[Image:RttyWindow.PNG|frame|center|RTTY TX/RX Window]] | ||
| + | |||
| + | For more information, see [[RTTY#Receive.2Ftransmit_window|RTTY Receive/Transmit window]] in the [[RTTY]] chapter. | ||
| + | |||
| + | ==Rotators== | ||
| + | <code>Windows | Rotators</code> | ||
| + | <br> | ||
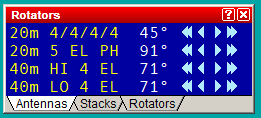
| + | Opens (or closes) the Rotators window, which displays the true beam heading (after adding any programmed offsets) of all the antennas available on the current operating band or bands (two bands if using two radios). | ||
| + | |||
| + | [[Image:WindowsRotatorsConnected.PNG|frame|center|Rotators window with true heading of four antennas on current operating bands]] | ||
| + | |||
| + | The three tabs at the bottom may be used to select what is displayed: | ||
| + | |||
| + | * '''Antennas''' - Display the true beam heading (by antenna name) of all named antennas defined for the current operating band or bands. Any defined antenna offsets are used to calculate the displayed heading. Arrow buttons can be used to rotate one antenna at a time. | ||
| + | * '''Stacks''' - Display the true beam heading of any wtRotator "Stacks" (or "Groups") on the current band. The buttons may be used to rotate the entire stack at once to the same heading, even if each antenna has a separate rotator. The heading of the first rotator added to a stack or group determines which heading is shown for the stack (even if another antenna in the stack is currently pointing in a different direction). | ||
| + | * '''Rotators''' - Display ''all'' connected rotators (by rotator name), regardless of band, and the heading of each, as displayed on the control box. Any antenna offsets are ignored. | ||
| + | |||
| + | Click on the arrow buttons to rotate the current antenna, stack, or rotator as follows: | ||
| + | * <code>[<<]</code> - Rotate 45° counter-clockwise | ||
| + | * <code>[<]</code> - Rotate 15° counter-clockwise | ||
| + | * <code>[>]</code> - Rotate 15° clockwise | ||
| + | * <code>[>>]</code> - Rotate 45° clockwise | ||
| + | You may also enter a callsign, DXCC prefix, or beam heading in the Win-Test logging Window, and press '''<code>[Ctrl]-F12</code>''' to rotate all antennas defined on the current band to desired heading (assuming your Grid Square or "Locator" is properly defined in the Contest Configuration screen). | ||
| + | |||
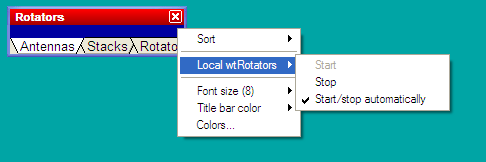
| + | ''Right click'' on the dark blue area of the Rotators window to display the pop-up menu. | ||
| + | |||
| + | [[Image:WindowsRotators.PNG|frame|center|Rotators window with pop-up menus]] | ||
| + | |||
| + | Use the pop-menu to sort the list, change font size, or start or stop the companion program, '''wtRotators''', on the local PC. wtRotators is a program that communicates with one more more rotators, similar to the way that wtDxTelnet communicates with one or more packet clusters. In can be located on the current computer or a separate computer on the LAN, whichever computer is physically connected to a rotator's serial port. | ||
| + | |||
| + | Select the '''Start/stop automatically''' option to have Win-Test automatically start and stop the wtRotators program on the local computer whenever you open or close Win-Test. | ||
| + | |||
| + | See the [[Rotators]] main topic for more information about configuring and using wtRotators with Win-Test. | ||
==DX-Cluster Monitor== | ==DX-Cluster Monitor== | ||
| Line 611: | Line 819: | ||
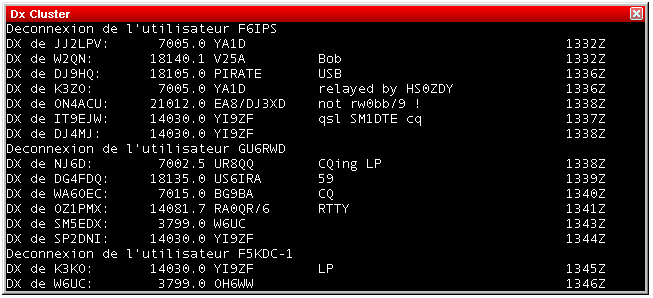
[[Image:WindowsPacket.gif|center|frame|DX Cluster monitoring window]] | [[Image:WindowsPacket.gif|center|frame|DX Cluster monitoring window]] | ||
| − | The contents of this window are logged to to the '''.pkt''' file. The window is | + | The contents of this window are logged to to the '''.pkt''' file. Logging can optionally be disabled to save disk space or to prevent malware scanners from slowing down the system -- in particular, when a lot of spots is being received (e.g. via RBN). To disable logging, right-click in the window and uncheck "Stream logging". |
| − | scrollable so that you can step back through history, back - even to the beginning | + | |
| − | of the file. The scrolled window will not update when new spots arrive. However, | + | The window is scrollable so that you can step back through history, back - even to the beginning of the file. The scrolled window will not update when new spots arrive. However, there is a little hint in the title bar like '''[+1138 lines]'''. In order to see all spots which have arrived in the mean time you have to move the scrollbar back to the end of the window. |
| − | there is a little hint in the title bar like '''[+1138 lines]'''. In order to see | ||
| − | all spots which have arrived in the mean time you have to move the scrollbar back to | ||
| − | the end of the window. | ||
For more information regarding the setup of DX Cluster connections, please see | For more information regarding the setup of DX Cluster connections, please see | ||
| Line 626: | Line 831: | ||
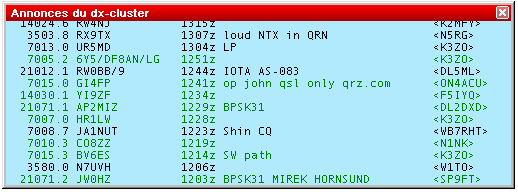
Opens (or closes) the DX cluster announcements window. | Opens (or closes) the DX cluster announcements window. | ||
| − | [[Image:WindowsDxClusterAnn.gif|center|frame|DX | + | [[Image:WindowsDxClusterAnn.gif|center|frame|DX Cluster Announcements Window]] |
| − | This window gathers all the spots coming from the DX cluster. | + | This window gathers all the spots coming from the DX cluster. New multipliers are green, other stations (but not dupes) are black. |
| − | + | With a right click, you can choose to display only new multipliers, only spots entered by the operator and/or selected bands: | |
| − | + | [[Image:DXClusterAnnouncementsBands.PNG|center|frame|Band selection pop-up menu for the DX Cluster Announcements window]] | |
| − | QSX information (like QSX 7239) is parsed from the comment field of the spot and handled correctly, so that when you click on such a spot, the transceiver will switch to split mode, put VFO | + | All spots are logged to the corresponding '''.dxc''' file in the log directory. Logging can be disabled to save disk space or prevent malware scanners from slowing down the system - in particular, when a lot of spots is being received (e.g. via RBN). Manually entered spots are still being logged to the '''.dxc''' file. |
| + | |||
| + | The displayed information is selectable (local time as a sun symbol, time spotted, spot comments, beam heading, and the callsign of the spot sender): | ||
| + | |||
| + | [[Image:DXClusterAnnouncementsDisplayOptions.PNG|center|frame|Display options for the DX Cluster Announcements window]] | ||
| + | |||
| + | A double click on a selected line will automatically switch the active radio to the spot frequency, and will grab the call and enter it in the callsign logging field. You just need to complete the QSO and press ['''<tt>Return</tt>''']. | ||
| + | |||
| + | QSX information (like QSX 7239) is parsed from the comment field of the spot and handled correctly, so that when you click on such a spot, the transceiver will switch to split mode, put VFO A on the RX frequency and VFO B on the TX frequency. QSX is indicated by an asterisk (*) character on the spotted callsign. Cross-band QSX frequencies are being ignored. | ||
Additional shortcuts: | Additional shortcuts: | ||
| − | * '''<tt>[Ctrl] + Dbl click</tt>''' on a spot removes the spot from the | + | * '''<tt>[Ctrl] + Dbl click</tt>''' on a spot removes the spot from the Announcements window (without confirmation). |
| − | * '''<tt>[Alt] + Dbl click</tt>''' on a spot loads the sub VFO (if | + | * '''<tt>[Alt] + Dbl click</tt>''' on a spot loads the spot frequency in the sub VFO of the active radio (if your radio supports it) |
For more information regarding the setup of DX Cluster connections, please see | For more information regarding the setup of DX Cluster connections, please see | ||
| Line 662: | Line 875: | ||
The font type and size, as well as the background and all the usual window colors can be changed through the context menu using a right mouse click on that window. | The font type and size, as well as the background and all the usual window colors can be changed through the context menu using a right mouse click on that window. | ||
| + | |||
| + | ==Contest Recorder== | ||
| + | <code>Windows | Contest Recorder</code> | ||
| + | <br> | ||
| + | Opens (or closes) the Contest Recorder window. | ||
| + | |||
| + | Before recording, right click and select [[Menu:Options#MP3_Configuration|MP3 Configuration]] to set the recording parameters. | ||
| + | |||
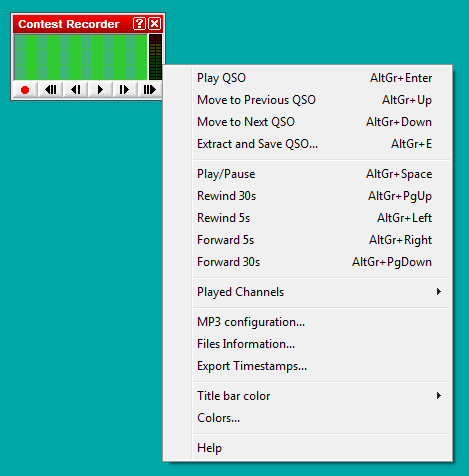
| + | A right-click on the Recorder window provides help to the keyboard shortcuts. | ||
| + | Use <code>right-click | Files Information</code> to see information about recorded files, or to delete recorded files. | ||
| + | |||
| + | The recording is a standard MP3 file which can be played on any MP3 player. Win-Test actually saves timestamps in the MP3 files which allows for a quick navigation when run from withing Win-Test. Win-Test creates sequential files up to a specific size (690 MBytes by default) and then switches to a new file. | ||
| + | |||
| + | [[Image:ContestRecorder.PNG|center|frame|Contest Recorder window with context menu]] | ||
| + | |||
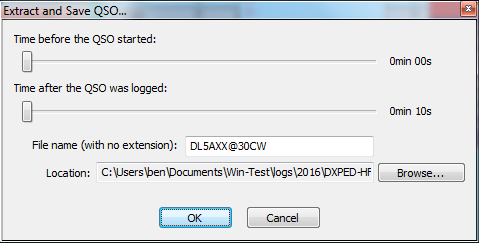
| + | The Contest recorder is a powerful tool to check your copying abilities, verify notes you have made during the contest or let others listen to what was audible on your end of the QSO. The shortcut '''<tt>AltGr+Enter</tt>''' quickly lets you jump to a specific QSO recording and you can then use the fast forward and fast backward functions to play it over and again. | ||
| + | |||
| + | [[Image:ContestRecorderExtractQSO.PNG|center|frame|Extract QSO dialog]] | ||
| + | |||
| + | Please note that in some contests, modifying your log after the contest is against the rules. However, it is never prohibited to go back to your log after having received your UBN report from the contest sponsor and find out why you failed to copy something or assumed a QSO where it wasn't a prefect QSO. | ||
| + | |||
| + | In very fierce competitions like WRTC, teams must provide a complete recording of the whole contest (both receive and transmit audio) to their referee. To record the transmit signal can be tricky and may require additional hardware, as most radios do not supply the monitor signal on the audio output line. | ||
| + | |||
| + | Win-Test uses the "standard" MP3 tags. | ||
| + | |||
| + | Title : Contest name + Category mode + File number (starting at 000) | ||
| + | Artist : Callsign | ||
| + | Album : Station | ||
| + | Year : Contest year (1st QSO) | ||
| + | |||
| + | In order to play QSOs, the MP3 tags must match the settings in the current .wt4 file. Otherwise, the recorder will display the message "No record for station X", with X being the current station nummer. | ||
==SSB bargraph== | ==SSB bargraph== | ||
| Line 670: | Line 914: | ||
[[Image:WindowsVuMeter.gif|center|frame|SSB bargraph window]] | [[Image:WindowsVuMeter.gif|center|frame|SSB bargraph window]] | ||
| − | This bargraph displays the audio level of the Win-Test's digital voice player (if used, of course). The appropriate level is the yellow part of this bargraph. | + | This bargraph displays the audio level of the Win-Test's digital voice player (if used, of course). The appropriate level is the yellow part of this bargraph. The windows can be rotated by 90 degrees. |
==Close all Windows== | ==Close all Windows== | ||
Revision as of 16:35, 20 November 2020
Menu:Windows
Most of the windows have a context or "pop-up" menu which can be opened by right-clicking on the window.
All windows can be moved by "dragging" the title bar with the mouse pointer. Simply hold down the left mouse button while the cursor is over the title bar, and drag the window with the mouse. Another option is to hold down the Ctrl key and the left mouse button while the mouse pointer is positioned anywhere within a window (except for the RTTY reception windows), then drag.
Tip: Hold down the Shift key while dragging or resizing a window to "snap" it into position, right next to the edge of an adjacent window.
Log Entry (Main window)
Use the Win-Test main window or "Log Entry" window to enter all QSOs made on the primary radio. The window displays the last nine QSOs in the log, plus a tenth line for entering the next QSO. The title bar displays the current log file name, the station name entered in the Contest Configuration window (e.g. "[Shack]"), and the current operator's callsign (for multi-ops that use the OPON or LOGIN text commands). By default, the Win-Test main window serves as a background for all other windows, but you may also choose to have every window "float" independently (see Menu:Options#Windows).
When you close the log entry window, Win-Test terminates.
Any QSO may be edited simply by typing over anything that needs correction. Use the [Up arrow] and [Down arrow] keys to edit previous QSOs. To restore the original QSO data, press Ctrl-Z before moving the cursor from that line. You can also delete a QSO (if single-op), though it is usually better to just enter a duplicate QSO -- see Menu:Edit#Delete_QSO for more information.
When the cursor is positioned in the callsign field, data is entered in "insert mode", that is, typing does not replace characters, it only inserts them. In all other fields, data is entered in "overtype mode". See this entry in the FAQ for the rationale.
The [Spacebar] key is used to quickly move the cursor back and forth between the callsign field and the received exchange field, skipping over the RST columns.
Tip: Enter a "?" character in the middle of a callsign or exchange as a placeholder for missing information, e.g.
F?MZN. Then when you press [Spacebar], the cursor will jump directly to the "?" character, and you can overtype it with the missing data (even in the callsign field).
The [Backspace], [Del], [Left arrow], [Right arrow], [Home], [End], [Ctrl][Left arrow] and [Ctrl][Right arrow]keys operate conventionally, within a single field; they do not move the cursor outside of the current field.
The [Tab] key may be used to position the cursor under the RST sent column as well as callsign and exchange. The [>] and [<] keys work similarly, but they also allow you to move the cursor to the QSO time field for direct editing. You can also change the time, date, frequency, serial number sent and other fields of a QSO by positioning the cursor on any line and pressing [Alt-F] to display the Edit QSO pop-up menu.
You may scroll back through the entire log by pressing the [PageUp] and [PageDown] keys.
Tip: Press Ctrl-[PageUp] to scroll back in the log by 24 hours.
Enter a QSO number on the last line and press [Ctrl-g] to "Go to" that QSO number in the log. Press [Ctrl-g] [Enter] to return to the bottom of the log.
Enter a callsign, prefix or beam heading (0 to 360°) on the last line and press [Ctrl]+[F12] to rotate to that heading. Press [Alt]+[F12] for long (or "alternate") path. For more information, see Rotators.
Many other keys may be used in this window to assist with rapid data entry. For example, [F11] clears the entire QSO, whereas Ctrl-W clears only the current field. See Keys - Editing and moving around the QSO entry line.
The font size, background color, and header line attributes of this window may be adjusted by right clicking and selecting the Log option (see Menu:Options#Log). The yellow header text can be centered, left-justified, or completely hidden.
The columns vary from contest to contest. In the CQ World-Wide example above,
- QSO - raw QSO number. Can be hidden using Hide QSO numbers (recommended for Multi-Multi contests with a sent serial number)
- Bd - band. Can be changed with [Alt-F1], [Alt-F2], or [Alt-F]
- Time - QSO time (UTC). Can be changed by moving the cursor with the [<] key, or [Alt-F]
- Callsign - Callsign of station worked.
Tip: Enter Win-Test text commands (menu shortcuts) in the callsign field.
- Sen/Rcvd - Sent and received exchanges
- Mult - multipliers and other information:
- C - Country multiplier
- Z - Zone multiplier
- DUPE - Duplicate contact
- ???? - Multiplier in received exchange field not recognized (e.g. unrecognized state or section abbreviation, zone number out of range)
- //// - Unrecognized country prefix
- !!!! - Multiplier violation (non-mult worked by a Mult station in a Multi-single, band change violation, etc.)
- other - Prefix, country, state, grid, etc. multiplier
- Pt - QSO points
- Stn - Station identifier (can be changed by pressing Alt-Y - see Keys#Multi_Operator)
- R1/R2 - Run 1 or Run 2 (multi-two), or Radio 1 / Radio 2 (SO2R).
- R/M - Run or Mult (Multi-single)
- + (suffix) - Indicates QSO data entered by a support or partner station
Finally, a red information line at the bottom of the window displays additional information, such as
- * New zone *
- * New country *
- * Dupe with #1963 at 23:59Z 2008-11-30 (25) *
- * Spotted by F5MZN *
- Brief one-line packet cluster announcements of new multipliers
Worked Gridsquares
Windows | Worked Gridsquares or Alt-L
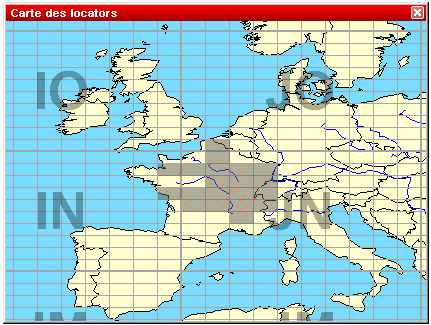
Opens (or closes) the gridsquares window. The gridsquares worked are in grey, the red spots are the stations worked and the green spots are the stations spotted. The current gridsquare is displayed in red color to give an indication of direction. This works even with only four of the six characters entered.
If the DX-Cluster Announcements window is opened and the gridsquare of a spot is known, passing the mouse over this spot will blink its location in this window.
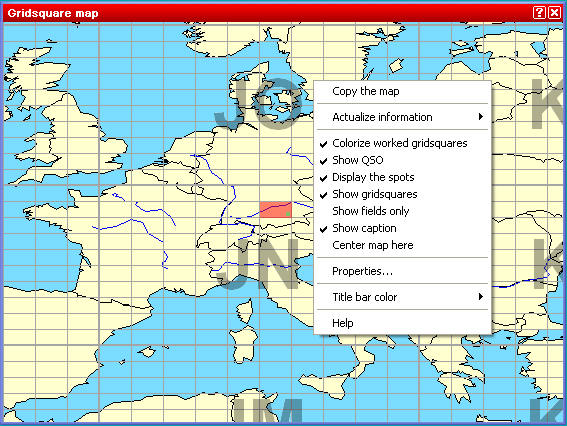
Right click on the map to display the pop-up window:
- Copy the map copies the image to the Windows clipboard
- Actualize Information controls when the map will be updated:
- Pressing the spacebar
- Automatically
- Colorize worked gridsquares marks worked grid squares in gray
- Show QSO marks QSOs with a red dot
- Display the spots marks spotted stations with a green dot
- Show gridsquares draws the squares and the grid square lines
- Show fields only turns grid square outlines off
- Show caption displays the major grid square names (first two letters)
- Center map here lets you move the center of the map interactively.
Note: This option is available only if you have not selected "Always center on the operating QTH" in the Properties dialog (see below).
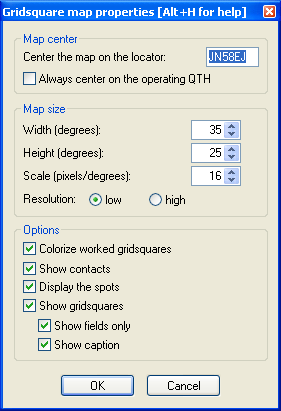
- Properties... allows you to modify several display parameters:
The larger the scale, the bigger the map.
Worked Zones
Windows | Worked Zones or Alt-Z
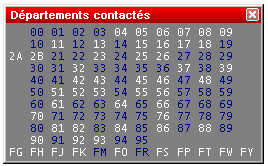
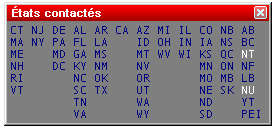
Opens (or closes) the worked zones window. The title of this menu item will fit to the chosen contest.
The window displays the worked multipliers (in blue) or not (in white) on the current band, and possibly the current mode.
Some examples:
Furthermore, with a right click on this window (if the contest is multi-bands and/or multi-modes) you can display the distribution of these multipliers by band (and/or mode).
At last, the same contextual menu allows you to copy all the datas of this window into the clipboard as an image or a text, and directly paste it as a text file or an Excel (TM) or OpenOffice spreadsheet.
Worked DXCC
Windows | Worked DXCC or Alt-M
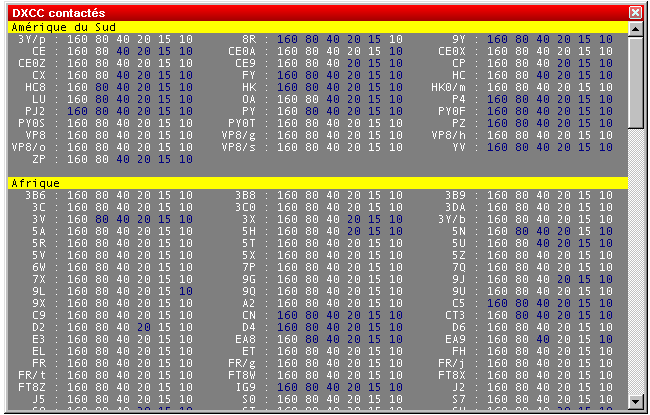
Opens (or closes) the worked DXCC window. The title of this menu item will change with the contest chosen.
If one DXCC country has been worked on a band (possibly a mode), this band will be displayed in blue, otherwise it remains in white. This window is resizable.
A right click on this window allows to display the countries alphabetically sorted (within the same continent), or sorted by number of band/mode worked. More, to easily search for missing countries, the countries worked on all bands can be hidden (clean sweeps). Also, countries never worked in the contest can be hidden.
You can easily move to the next (or previous) bookmark - displayed on a yellow background by default - by holding the Shift key down, while rolling your mouse wheel.
Last, all the data included in this window can be copied as a text file, and pasted in text or directly in an Excel (TM) or OpenOffice spreadsheet, for a later analysis.
Check Callsign
Windows | Check Callsign or [F9]
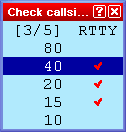
Opens (or closes) the worked callsign window. This window displays a checkmark if and on which bands a specific callsign has been logged before. Depending on the type of the contest, the display may show more than one column to display the different possible modes.
Moving the mouse cursor over the checkmark will bring up additional information about this QSO. And a double-click on it will move the cursor to this QSO.
Check Multipliers
Windows | Check Multipliers or [F10]
Opens (or closes) the checking multipliers window.
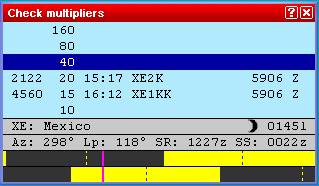
To use this window, enter a callsign or country prefix in the data entry area of the main logging window. The dark blue line indicates the current band. The other lines indicate whether this multiplier has been worked or not on other bands (and in other modes if the contest rules permit). If the callsign entered has been worked on other bands, Win-Test displays those QSOs. Otherwise, the callsign of the first station worked in that multiplier on that band is displayed, if any. For the CQ World-Wide DX contest, display priority is: same callsign, same country and same zone. An uppercase "Z" in the last column indicates that the zone and country have been worked on the indicated band. A lowercase "z" means the zone has been worked, but not the country. And of course a blank line indicates that both the zone and country are needed. See also the Search for Worked Multipliers window.
Additional information about the multiplier is displayed at the bottom:
- The official country prefix and country name
- A small icon indicating if it is local day, night, or sunrise/sunset time in that country
- The current local time in that country (suffixed by a lowercase "l")
- The short (Az) and long path (Lp) beam headings (azimuths) to this multiplier (based on the station locator entered in the Contest configuration screen)
- The sunrise (SR) and sunset (SS) time in this country, expressed as UTC (suffixed by a lowercase "z"). These times are computed from the geographical coordinates given taken from the CTY* file or your QTH locator, if specified in the setup dialog.
- Graphical indication of the sun status on both sides of the QSO (may be disabled via the context menu)
- Two yellow bars represent the sun over 24 hours of the day. The top bar displays the situation at the DX location, while the bottom bar represents your own location.
- A pink cursor denotes current time.
- Dotted lines represent local noon or local midnight.
A double click on a line will move the cursor to the specified QSO. Press [Ctrl-End] or [Ctrl-G], [Enter] to return the cursor to the blank line at the end of the data entry area.
Finally, using the context menu (right click on the window), you can change Actualize information to Automatically (recommended) or to Pressing the space bar to indicate when you want the check multiplier screen to be updated. "Automatically" updates the screen after each keystroke. Any modification in the received exchange field (e.g. zone) also updates this check multiplier window.
Search for Worked Multipliers or Partial QTH Locators
Windows | Search for Worked Multipliers
Keyboard shortcut: Shift+F10
Lists all the callsigns logged in a specified multiplier (Zone, State, ARRL Section, Grid Square Locator, etc.).
To quickly list everyone you have logged in a particular multiplier, sorted by band, enter the multiplier in the callsign field and press Shift+F10. The Check Partial Window will be displayed in a different format, as shown below.
Any further typing in the callsign field restores the Check Partial Window to its normal appearance. You can also use [Ctrl-W], [Alt-W], or [F11] to erase the multiplier from the callsign field.
Note: This search only works for contests where the multiplier is logged as part of the exchange, so it doesn't work for the CQ WPX contest or the ARRL DX Contest (when operating from the U.S. and Canada).
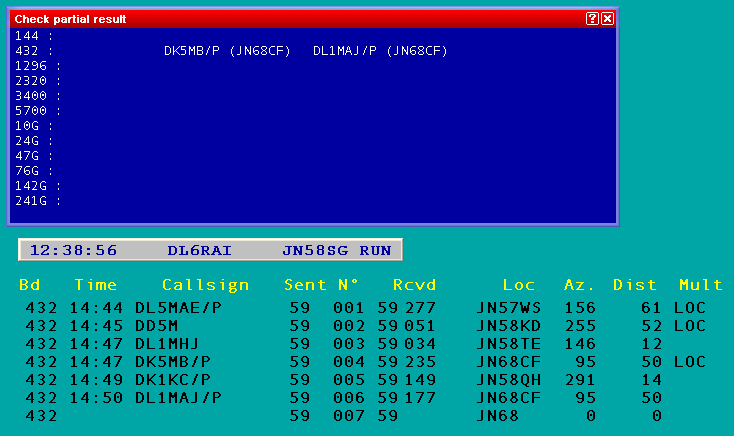
For VHF/UHF/SHF... contests, this function is dedicated to partial QTH locator search. Enter the partial QTH locator either in the callsign or in the locator field and then press Shift-F10.
Check Partials
Windows | Check Partials or [F12]
Opens (or closes) the Check Partials window. The master file used is normally MASTER.SCP or DEFAULT.SCP or contest.DTB, as described under Check Partial and Np1 Files.
If this window is open, and at least 3 characters are entered in the callsign logging field, Win-Test looks in the master database for the callsigns including the 3-character string.
For example, in this upper screen-shot, the partial callsign entered is "A2Q". All the callsigns found by Win-Test show this string.
The white callsigns are those not worked yet. The green callsigns are stations worked on another band, but not the current band. The red callsigns are the dupes (callsigns already worked on the current band).
Double clicking on a callsign copies it into the callsign logging field.
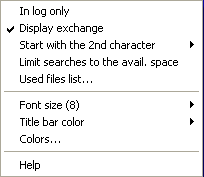
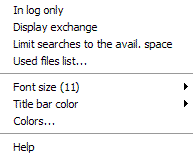
Right click in the window to brings up a context menu where you can choose if Win-Test is to use the master database or just your log. Another option is (in some contests) if you want to see the expected report in that window (from contest.DTB).
For slow contests, it might make sense to start the check partial search after the second letter is entered into the callsign field, rather than the third.
Another option allows you limit the number of callsigns displayed to fit the available space in the window.
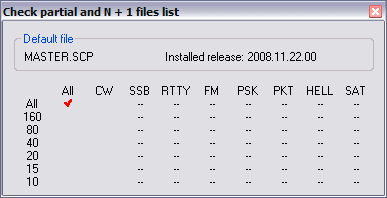
Finally, the option Used files list will display the master file that Win-Test has loaded to feed the Check Partials window:
.
See Check Partial and Np1 Files for more info about naming super check files, search order, and how to update them.
In HF contests such as CQ World-Wide, you can enter a zone number in the callsign field and press Shift+F10 to display a list of prefixes in that zone, and a list of stations worked in that zone.
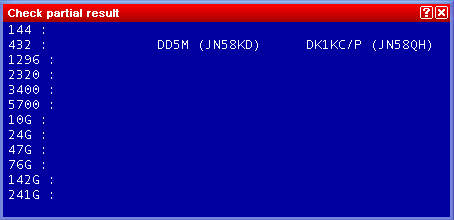
In VHF/UHF contests, pressing Shift+F10 on a partial QTH locator changes the Check Partials Window to the Partial QTH Locator Search Window. This feature is helpful to identify stations in a VHF/UHF contest when you copy only the QTH locator.
You may enter the partial QTH locator either in the callsign or in the QTH locator fields. A minimum of four characters has to be present in order to check the locator.
Check N + 1
Windows | Check N + 1 or [F8]
Opens (or closes) the N + 1 window. The master file used is normally MASTER.SCP or DEFAULT.SCP or contest.DTB, as described under Check Partial and Np1 Files.
If this window is open, and at least 3 characters are entered in the callsign logging field, Win-Test looks in the master database for the callsigns differing from the partial callsign by one character.
This command also detects 2-character swap (dyslexia), as well as one missing character.
If the callsign is not included in the master database, and has not been worked yet, it is considered a UNIQUE. Otherwise, it is displayed in the first position.
The white callsigns are the stations not yet worked. The green ones are those worked on another band, but not the current band. The red callsigns are dupes.
Double clicking on a callsign copies it into the callsign logging field.
A right click in the window brings up a context menu where you can choose to use the master database or just your log. A second option (in some contests) is if you want to see the expected report in that window (from contest.DTB). You may also wish to limit the number of callsigns displayed to the available space in the N+1 window. Finally, the option "Used files list" will display the master file that Win-Test has loaded to feed the Check Partials window.
Partner
Windows | Partner
Opens (or closes) the partner window.
This feature is especially useful in a Multi-OP environment when facing large pile-ups and/or weak signals or when you are training a new operator.
Situation: You get several callers coming back to your CQ. You pull out one callsign - but sometimes you are able to copy another callsign or at least parts of it. If you could remember this second call after the first QSO, you'd be able to call the second station right away (without QRZ) and save time.
Improvement: Set up a second operator (OP2), a second computer and a second pair of headphones, sometimes a second receiver. Both OPs now open up the Partner window on their computer. The running operator OP1 continues like before: He works the first callsign. In the mean time, the OP2 supports OP1 to copy the callsign - or alternatively - he can add callsigns he copied from the pile-up by entering the callsign on the QSO entry field and then pressing Alt-Enter.
This callsign will now be displayed on all computers in the network that are set at the same band and mode. OP1 will see the new callsign after his first QSO and calls that station right away.
The Partner window can hold up to 9 callsigns, and theses calls can be pulled into the callsign field with Alt-1, Alt-2...Alt-9. Usually this is done by OP1 to log that callsign, while OP2 uses this function to remove the call from the partner window. Once the QSO is logged, that callsign will disappear from both partner windows.
You can also swap the callsign field with one of the entries by pressing Ctrl-1, Ctrl-2...Ctrl-9.
Using message variables on CW and RTTY you can now enter a QSO (with correction or not), grab another callsign from the Partner window, and send the new report in one keystroke, by using:
$CORRECT TU $CR NOW $GRABPARTNER $NEXT $F2 (sends call if corrected before the TU)
for the [Plus] key, or
$CURRENT TU $CR NOW $GRABPARTNER $NEXT $F2 (resends full call before the TU)
assuming $F2 contains the report.
If you want to manually grab a callsign from the Partner window you can use:
$PREV TU NOW $LOGGED $F2
Then
- Use the [Enter] key to silently enter the current QSO
- Grab the next callsign from the Partner windownd (via double-click or Alt-n)
- Send the message above
When a QSO is logged locally or via the network it is checked against the contents of the partner window, and - if found - removed from the partner window as it is now obsolete.
If automatic exchange guessing is enabled, a callsign grabbed from the partner window will have the exchange window filled in and will update the check partials and N+1 windows.
Finally, the entire Partner window content can be cleared by using the appropriate context menu item or by pressing Alt-Backspace. Individual entries can be removed via Ctrl-Doubleclick.
Up to three support partners can be engaged. If you do not want the partner to be limited by band and mode, use the "No band/mode filtering" option in the context menu of the partner window.
A real-time mode is available in the partner window's context menu. This allows the main operator to have a real-time view on what the partner(s) is(are) typing (character by character) so he(she) does not have to wait until they press Alt-Enter in this time-critical situation. For this to work, the supporting partner has to change his station type to "Support" (see section Menu:Commands#Station_Type), indicated by R+ on the QSO entry line.
In the context menu of the partner window there are two settings that can be done, when more then one partner (up to 3) is engaged:
- as support, must be selected to which slot this partner will send its real-time characters
- as runner, must be selected how many slot are being displayed at the partner window top
The runner will then grab a real-time slot with Alt-Space, or in all cases, he can also double-click on any callsign of this window.
Status
Windows | Status or Alt-J
Opens (or closes) the status window.
This window indicates the status of each station connected to the network. From left to right, are displayed :
- Station name
- Current band and mode
- Station type
- QSY frequency of the current band and mode
- Radio 1 frequency
- Radio 2 frequency
- Operator
- Time left before a possible QSY, according to the 10 minutes M/S rule, or "OK" if the station is allowed to make a QSY on another band. Note that this column only appears if the contest specifies this particular rule.
Your own station is displayed in a deep blue background. The active radio of each station has its frequency in red characters. The list may be by band and station names when it gets cluttered in a very large network by using the appropriate function in the context menu.
A double left click on a station name will display the chat dialog with this station name as default destination.
Opening the context menu with a right mouseclick will allow you to turn on network traffic logging. This might be useful for basic network troubleshooting. This log file uses the .ntk (stands for NeTworK) file extension.
Ping a specific station from the context menu on this station name and use "Ping XXX". The Win-Test version, the Master, Bridgehead, Sync indicators and the propagation time are returned in the Gab window (Alt-I). Reminder: You may also use the INV (stands for Inventory) text command to get a summary of the complete network.
A remote command to a specific station can be sent by opening the context menu on this station name and use "Send remote command to XXX...".
At last, a double left click on any frequency displayed will tune the current radio to that frequency.
Skeds
Windows | Skeds or Alt-B
Opens (or closes) the skeds window.
Skeds (Alt-E) and passed stations (Alt-D) are displayed in this window. See Multi-op/Passing.
- A grey background means that the sked is over for more than 10 minutes.
- A yellow background means that the sked is planned within less than 10 minutes maximum (a "hot sked"). If the window was not open, it will pop-up to remind the operator of the hot sked. The pop-up will be suppressed, however, if Win-Test is running minimized.
- A green background means that the sked is planned in more than 10 minutes.
A - (minus) sign before the hour means that the sked is over for more than 24 hours. A + (plus) sign before the hour means that the sked is planned in more than 24 hours.
A right click allows to sort the skeds window by time or by band. You can also hide the older skeds, and modify or cancel a sked. In a multi operating configuration, the sked data are sent across the network.
At last, note that a double left click will tune the current radio on the sked frequency and capture the callsign of the scheduled station in the callsign logging field. You will thus just need to press [Return] after completing the QSO!
Solar Activity
Windows | Solar Activity
This option displays solar activity data that has been received from the DX cluster connection. You can chose between SSN, SFI, K and A indexes. It is an interesting tool to discover trends in propagation during a contest.
As there are two sources on the DX cluster for this kind of information, you may chose between WWV and WCY. This information can also be applied - in conjunction with HamCap - for specific propagation forecasts. See Menu Options HamCAP in this manual.
Click on the triangles to open or close a chart. You may open or close all charts at once by holding the [Shift] key down while clicking on one of the triangles.
QSY Wizard
Windows | QSY Wizard
The QSY Wizard can only be used if HamCAP is installed and running. You must also have Options | HamCAP | Tab set to Charts.
After working a DX, pressing Ctrl-P will bring up the HamCAP window with a propagation prediction to this DX. Then, the QSY Wizard will display the bands on which to which a QSY or sked may be useful:
In the above example CN2R has been worked on 20m. After pressing Ctrl-P the wizard tells us that a QSY may be promising to 15, 40, 80 and 160m. For 10m, however, the wizard recommends a sked at 18:30 UT instead. This is the peak time predicted by HamCap for this path but MUF will be only be 20.1 MHz (the mouse cursor was over the 18:30/28MHz yellow square while creating this screenshot).
Extra Information
This window displays data included in .XDT (eXtra DaTa) files. These files are textual and have a very basic syntax. These files are suitable for name lists (your favorite contest friends or club members, whose names you never get to remember in the middle of the contest) or information about a station's capabilities on other VHF/UHF/SHF bands so that you will want to ask for a sked.
XDT Files
The first column is the callsign of the station for which information is to be displayed. The rest of the line carries the information to display. There can be only one line per callsign. Lines have to be formatted in MS-DOS mode, i.e. CR/LF at the end.
You can set up to 10 default extra data files by the menu function Options | Data files | Default data files. These files will be opened with every log. They must be located in the WT installation directory. Refer to Menu: Options Default extra data files... for detailed information.
You can also add log-specific extra data files by using the Extra files... item in the context menu of this window (right-click to open the contextual menu). A new window will open-up where you can click the ADD button to browse the computer resources to locate and select the file you need (see picture).
There is no limitation to the location and the number of these log-specific files. The added file names and paths will then be save in a file with .xdl extension among all the other contest specific files (.LOG, .SUM, .pkt, .gab, .wtb, etc.).
If you modify an .XDT file while it is in use, you must reload it by using the Reload files item in the context menu.
Note: This function is designed to work with no more than a few thousand callsigns only. Don't try it with millions of lines or a Callbook file!
Directives
Directives are special statements in the data file beginning with a hash sign and a space.
The # TITLE directive is used to display a title in the window, like this:
# TITLE Operator Names
CT1BOH Jose
DJ1YFK Fab
DL4NER Werner
DL6RAI Ben
F5HRY Herve
F5MZN Olivier
F6FVY Larry
M0CLW Simon
M3PHP Peter
The # VARIABLE directive allows you to send the extra information in a CW message by using a variable name. The variable name must begin with the $ character.
Example: The following line will substitute the $OPNAME string in the CW messages with the extra info included in this file, if the sent callsign has matching data.
# VARIABLE $OPNAME
Note: The variable subsitution only works with the internal CW keyer.
Summary
Windows | Summary or Alt-S
Opens (or closes) the scoring summary window.
The displayed number of QSO does not include the dupes. Thus, the QSO column displays only the QSO that have generated points.
A right click allows to copy the scoring summary data in the clipboard as an image or as a text file (in WT language or in English, depending on the contest).
Live Score
The context menu also allows you to configure and enable live score reporting by using a specific UDP broadcast protocol [1]. Please note that additional third-party software is needed to post your score to one of the live scoreboards on the internet.
For testing purposes, there is an option to create a live score broadcast "now"; typically, it will be broadcasted automatically once every five minutes or however you set up the periodicity. Live score broadcasting in a multi operator environment is limited to the station that is the network time master.
For further information about live scores, please see [2] and [3] (German language).
Rate
Windows | Rate or Alt-R
Opens (or closes) the rate window.
This window is divided in different parts:
The upper part displays the rate of the last hour, of the last 10 QSO, and of the last 100 QSO. It also displays a moving graph of the rate, computed on the last 15 minutes before the current QSO. The lower portion of that window displays additional rate information in text format.
Graphs
The graph is calculated on the last 15 minutes (default). Each bar, thus representing one minute on the air, calculates the moving average rate on the last X minutes, this time being selectable between 5 to 30 minutes. A short period will be selected for a contest with high rates (international HF, such as CQWW or WPX), and a longer one for a contest with slower rates (such as a national HF, or a VHF).
Below is a display that shows instant continent distribution of previous QSOs. It uses the same timing parameters as the instant rates above.
The QSO Timer Alarm progress bar appears below that. This bar gives a clear visual indication of the time elapsed since your last QSO. Right click and select Off-time timer alarm to set the full scale range of the progress bar. In the screen shot above, it is the red bar showing over 100H elapsed since the last QSO, but normally it is a green progress bar that advances from left to right. It begins as 100% green and slowly more of it turns red until it reaches full scale, when the bar becomes 100% red. The default scale is 5 minutes, but it is configurable between 1 and 120 minutes.
Text Information
The next part displays information about Time ON and Time OFF. For new logs, the off-time calculation is based on the contest rules. You can still use a custom setting to check your operating efficiency. Right click and select Off-time calculation threshold. If the contest rule is unknown, 15 minutes will be used as a default threshold.
The next part shows information about band changes.
The central part gives general information about the point statistics of the contest, e.g. time by mult, QSO counts, Mult worth, etc.
The bottom part indicates the current mode and, in CW, the current speed, as well as the status of the automated CQ repeat mode. Some indicators that may appear there include:
- CW - Operating mode is set to CW (press Ctrl-F1 or Ctrl-F2 to change)
- SSB - Operating mode is set to Phone
- RTTY - Operating mode is set to RTTY
- 34 WPM - CW speed in Words Per Minute (adjust with Alt-F9, Alt-F10, and Alt-V)
- 34/32 WPM - Independent CW speed between Win-Test and WinKey pot (WinKey speed displayed on right)
- S - Operator is listening in Stereo mode (operator pressed AltGr-S or Ctrl-Alt-S, press AltGr-A or Ctrl-Alt-A to remove)
- T - Operator is listening to the Secondary Radio (operator pressed AltGr-T or Ctrl-Alt-T, press AltGr-A or Ctrl-Alt-A to remove)
- REPEAT - Automatic repeating CQ feature is active and [F1] has been pressed. See Automatic CQ Repeat.
Context Menu
A right click allows you to choose on what bands and modes these calculations have to be done:
- All : No filtering is done
- Current : Filters only QSO done in the mode and band of the current radio
- According to QSO : Filters only QSO done in the mode and band of the current QSO
You can also choose to display the calculations as :
- QSO / h : Only based on the number of QSO
- Points / QSO : Averages the points of the QSO
- Points QSO / h : Without the multipliers
- Points / h : Including the multipliers
Thresholds are defined and can be modified on the following properties:
- Instant moving graph window -how many minutes of history are taken into account
- Off Time Alarm - after how many minutes the color of the green bar will turn red
- Off-time calculation - after how much time of no QSO, time is counted towards off-time (may be contest specific)
- Last band change method - which event triggers the timer after a band change
Moreover, the contents of the rate window can be customized by selecting one or more of the following, which are listed under the Display menu item of the context menu:
- Instant rate moving graph
- Instant continents distribution
- Off-time timer
- Time ON / Time OFF
- Band Changes
- Band Changes elapsed times
- QSO/Mult ratio
- Distances Data
Finally, right click and select the Copy menu item to copy this window, as an image, to the Windows clipboard.
Note: The available menu items in the context menu may vary depending on where you right click in the window.
Statistics
Windows | Statistics or [Ctrl-F9]
Opens (or closes) the Statistics window, a rate sheet.
The size of this window can be changed by dragging the edges. The window displays the number of QSOs, hour by hour, for the entire contest period.
The time span is fixed depending on the contest type. For the shorter contests, the display spans 24 hours; for the major contests, it spans the full 48 hours. For DXpeditions, it is configurable from 1 to 15 days via the [Days...] button in the Contest Configuration window.
Switching to the Targets tab in the statistics window, you may compare your current score to a pre-loaded estimate, which may be derived from a previous contest operation or generated by hand. Positive offsets with respect to the target file are shown in green color, negative offsets in red color.
You may also display hour-by-hour comparisons with the targets.
Please see Menu | Tools | Load a targets file... for further information on exporting and loading target files.
Switching to the Continents tab displays continental QSO statistics.
A right click allows to set different display options:
Displayed Data
- Select which kind of data to display: QSOs, Multipliers, QSO Points, etc.
Band
- All (total): Single color display, all bands combined
- All (detailed): Multicolor display, one color per band
- Current: Displays statistics for the current band
- According to QSO: Displays statistics for the band of the currently selected QSO
Mode
- All (total): Single color display, all modes combined
- All (detailed): Multicolor display, one color per mode
- Current: Displays statistics for the current mode
- According to QSO: Displays statistics for the mode of the currently selected QSO
Display
- By time: Displays an hour by hour comparison
- Overall: Displays a cumulative (overall total) comparison
Another option allows you to load a targets file for comparison, or export a targets file based on the current log.
Finally, it is possible to copy any of the Statistics windows as image or text to the Windows clipboard. Then you can copy the data into to a text document or even into an Excel® or OpenOffice spreadsheet.
Gab
Windows | Gab or Alt-I
Opens (or closes) the gab window.
All the gab chat is displayed in this window. With a right click, you can choose to display (or not) the time when the message was sent, including (or not) the seconds. Moreover, this window can be copied as an image.
In the context menu, the option "Taskbar flashing" can be selected to make the Windows Task Bar flash every time a gab is received.
All the gab chat is recorded in the .gab file of the current contest.
A double-click in a station name in this window will open the chat dialog, with this station name as default destination.
If the gab window becomes too cluttered, you may wish to clear it via the context menu.
World Map
Windows | World Map
Opens (or closes) the map window
The dimensions of this worldmap window can be modified. With a right click, you can display (or not) the grey-line. Moreover, you can increase or decrease the format (zoom).
An additional option allows you to display only the greyline terminator plus a little symbol for the sun which makes reading the information a little easier at times.
Radio 1, Radio 2 (Band Maps)
Windows | Radio 1 or Windows | Radio 2
Opens (or closes) the radio window.
These resizable windows are also called Band Maps.
The frequencies of the 2 VFOs are displayed. The active VFO has a yellow background.
If Win-Test has a DX cluster connection, the bandmaps are automatically fed from the DX cluster data stream, from logging contacts, and by manually adding information using Ctrl-Enter instead of [Enter]. The green callsigns are the new multipliers, the black ones are the new callsigns (not worked so far), and the dupes are in grey and slanted font.
A double click on a callsign will automatically put the radio on the spot frequency and capture the callsign in the logging field. You just need to complete the QSO and press [Enter]! Press [Alt-F4] to return to your run frequency.
An [Alt]-double click on a callsign will load the spot frequency into the Sub VFO (VFO B), if your radio supports it.
While in split mode during 40m and 80m SSB operation, when adding a spot to the band map, Win-Test remembers both the RX and the TX VFO frequencies, and will store this information so that when you select the spot, both VFOs will be set correctly, and you'll be ready to call (unless the QSX frequency has changed in the mean time).
Moving the mouse pointer over a spot in the band map will bring up additional information, such as the age of the spot the callsign of the spotter, and any comments. Double-clicking the spot with the [Ctrl] key removes the spot from the band map (without confirmation).
Other key combinations can be used to operate with the Band Map.
A right click on this window brings up its context menu.
- The top option in this Context Menu allows you to program the Sub VFO (if your radio supports it) with this spot.
- The Propagation submenu item allows you to gather propagation information via HamCAP (if installed)
- The next two entries Modify... and Delete allow you to change or remove spots in the band map. Note that you can quickly remove a spot by double-clicking it with the [Ctrl] key pressed.
- Additionally, you can change the scale of the band map display from 1:1 up to 30:1. The scale can also be set through the mouse wheel.
- More options are hidden in the sub menus Display Options and Properties... where one can set a lot of minor details of the band map.
29S 11Nat the bottom indicates there are 29 spots total, 11 new calls (not yet worked).- The List tab of the band map has a context menu with several sorting options:
- The List tab of the band map has a display option that lets you hide dupes and display additional information:
Special cursors
Special indicators for the last CQ frequency or the QSY frequency (set with the PASSFREQ text command, or with the Commands | QSY frequency menu option) can also be activated (see picture).
To enable them, tag the CQ cursor and/or the QSY cursor items in the Display Options submenu of the context menu itself.
Extended information
The Display Options menu also allows you to select if the expected exchange will be displayed in the band map and other minor details, like day/sunrise/sunset/night symbols, time and sender, comments etc.
Markers
The Display Options menu allows you to enable the displaying of markers. These can be useful for beacons and other known stations on the bands.
Markers are defined by text files with a .mkr extension located in the Win-Test directory. WT can use and display up to 10 files simultaneously; they can be selected in the Options | Data files | Markers files menu. For detailed information, please see Menu: Options Data files Markers files.
Marker display settings can be different for each radio. The syntax of the marker files is very basic and they are easy to create with a simple text editor like Notepad.
A marker is defined by its frequency (in kHz), a label (one word) and an optional tooltip (30 chars max.) that will flash when the mouse cursor is positioned on the marker for a few seconds. If you include a four or six character gridsquare locator, WT will display heading and distance to this gridsquare in the tooltip window.
Example:
  28205 DL0IGI Hohenpeissenberg JN57MT
  28257 DK0TEN Sipplinger Berg JN47NT
  28277.5 DF0AAB Kiel JO54GH
Two DIRECTIVES (or KEYWORDS) define the background and foreground color:
- # BACKGROUND color => Sets the background color of the following markers in the file. If no color is specified, the default color is green.
- # TEXT color => Sets the text color of the following markers in the file. If no color is specified, the default color is black.
The known colors are: White, Black, Red, Green, Blue, Yellow, Magenta, Cyan. The case of the color is irrelevant, so "green" and "Green" are identical.
Example :
  # BACKGROUND white
  # TEXT green
  #
  14100 Bcn NCDXF Beacon
This will display a white marker with a green text "Bcn". The associated tooltip will be "NCDXF Beacon". As usual, you can double-click on a marker to set the current radio on the frequency of the marker. A sample file NcdxfBeacons.mkr is located in the WT repository at: http://download.win-test.com/files/markers/. It displays markers for each NCDXF beacon.
You may build your own marker files (VHF beacons etc.) and share it with the WT community if you want.
Segments
WT can display band allocations for different license types in the bandmap tab of the radio windows. This allows you to select a run frequency which is in right band segment for US-Advanced or US-Novice amateurs for example.
Band segments are defined by text files with a .seg extension located in the Win-Test directory. WT can use and display up to 10 files simultaneously; they can be selected in the Options | Data files | Segments files menu. Please find more detailed information in Menu: Options Data files Segments files.
Due to space constraints - you can't have more than 5 segments displayed per band for any given frequency.
The segments display settings can be different for each radio.
The syntax of the segments files is very basic, and the files are easily created with a simple text editor like Notepad. A segment is defined by specifying its lowest and its highest frequency (in kHz). The two frequencies may be linked by an hyphen for easier reading. An optional tooltip text (30 chars max.) can be given to explain the meaning of the color segment. By placing the mouse cursor over a colored line in the band map display, the tooltip will display.
The BandMap segment color is indicated by the DIRECTIVE (keyword) COLOR like given below. The known colors are: White, Black, Red, Green, Blue, Yellow, Magenta, Cyan. The case of the color name is irrelevant. If no color is specified, the segments will be displayed in yellow.
Example:
  # COLOR Red
  14000-14150 Extra CW
  14150-14350 Extra SSB
  # COLOR Yellow
  14025-14150 Advanced CW
  14175-14350 Advanced SSB
  # COLOR Magenta
  14025-14150 General CW
  14225-14350 General SSB
This will display the US band allocation in the 20-m-band.
The segments order, and potential overlaps in the file are irrelevant. WT will take care to display them in an optimized way.
Two sample files are located in the WT repository at http://download.win-test.com/files/segments/
- UsSegmentsDetailled.seg displays all band segments for every US licence type.
- UsSegments.seg displays all band segments in which all US licencees are potentially active.
You may create your own band segments files for other countries, regions, etc. and share them with the WT community if you want.
Band Map properties
Selecting Properties... in the context menu of the Radio 1 or Radio 2 band map windows displays the Bandmaps Properties window:
Here you can define the lifetime of two kinds of spots, control the behavior of the logging window when you press [Ctrl-Enter] to create an operator-entered spot, control the automatic entry of data in the logging window when you grab a spot in the bandmap (via double click), select random 100 Hz TX frequency offsets to improve the chances of calling a spot on a clearer frequency (recommended), and the spot bandwidth for each mode (CW, SSB, RTTY) which is used to determine when two spots are on the same frequency. The spot bandwidth can be set between 0 Hz and 5000 Hz, in 100 Hz steps. The lifetime of spots in the band map can be changed from the default (60 minutes) to any other value below 100 minutes.
Search & Pounce Options allow you to add spots to the band map without having to press [Ctrl-Enter]. Simply enter the callsign and turn the VFO by the specified frequency change threshold to automatically populate the band map.
Note: To automatically populate the Band Map, you must be in S&P mode. Search & Pounce is not activated by default. Select Tools | Data entry | Enable Run/S&P switching (text command shortcut: RUNSP [Enter]), and then press [Ctrl-tab] once to toggle from Run to S&P mode. The clock window indicates the current mode.
Secondary Radio
Windows | Secondary Radio
Opens (or closes) the Secondary Radio window.
This window controls the "other" radio that is currently not in use during SO2R operation, not necessarily radio 2. For more information, please see SO2R/Second_radio_window.
RTTY (radio1, radio2)
Windows | RTTY (radio 1)

Windows | RTTY (radio 2)
Opens (or closes) the RTTY Transit/Receive windows.
For more information, see RTTY Receive/Transmit window in the RTTY chapter.
Rotators
Windows | Rotators
Opens (or closes) the Rotators window, which displays the true beam heading (after adding any programmed offsets) of all the antennas available on the current operating band or bands (two bands if using two radios).
The three tabs at the bottom may be used to select what is displayed:
- Antennas - Display the true beam heading (by antenna name) of all named antennas defined for the current operating band or bands. Any defined antenna offsets are used to calculate the displayed heading. Arrow buttons can be used to rotate one antenna at a time.
- Stacks - Display the true beam heading of any wtRotator "Stacks" (or "Groups") on the current band. The buttons may be used to rotate the entire stack at once to the same heading, even if each antenna has a separate rotator. The heading of the first rotator added to a stack or group determines which heading is shown for the stack (even if another antenna in the stack is currently pointing in a different direction).
- Rotators - Display all connected rotators (by rotator name), regardless of band, and the heading of each, as displayed on the control box. Any antenna offsets are ignored.
Click on the arrow buttons to rotate the current antenna, stack, or rotator as follows:
[<<]- Rotate 45° counter-clockwise[<]- Rotate 15° counter-clockwise[>]- Rotate 15° clockwise[>>]- Rotate 45° clockwise
You may also enter a callsign, DXCC prefix, or beam heading in the Win-Test logging Window, and press [Ctrl]-F12 to rotate all antennas defined on the current band to desired heading (assuming your Grid Square or "Locator" is properly defined in the Contest Configuration screen).
Right click on the dark blue area of the Rotators window to display the pop-up menu.
Use the pop-menu to sort the list, change font size, or start or stop the companion program, wtRotators, on the local PC. wtRotators is a program that communicates with one more more rotators, similar to the way that wtDxTelnet communicates with one or more packet clusters. In can be located on the current computer or a separate computer on the LAN, whichever computer is physically connected to a rotator's serial port.
Select the Start/stop automatically option to have Win-Test automatically start and stop the wtRotators program on the local computer whenever you open or close Win-Test.
See the Rotators main topic for more information about configuring and using wtRotators with Win-Test.
DX-Cluster Monitor
Windows | DX-Cluster monitor or Alt-O
Opens (or closes) the DX Cluster monitoring window.
The contents of this window are logged to to the .pkt file. Logging can optionally be disabled to save disk space or to prevent malware scanners from slowing down the system -- in particular, when a lot of spots is being received (e.g. via RBN). To disable logging, right-click in the window and uncheck "Stream logging".
The window is scrollable so that you can step back through history, back - even to the beginning of the file. The scrolled window will not update when new spots arrive. However, there is a little hint in the title bar like [+1138 lines]. In order to see all spots which have arrived in the mean time you have to move the scrollbar back to the end of the window.
For more information regarding the setup of DX Cluster connections, please see Commands | DX Cluster
DX-Cluster Announcements
Windows | DX-Cluster Announcements or Alt-A
Opens (or closes) the DX cluster announcements window.
This window gathers all the spots coming from the DX cluster. New multipliers are green, other stations (but not dupes) are black.
With a right click, you can choose to display only new multipliers, only spots entered by the operator and/or selected bands:
All spots are logged to the corresponding .dxc file in the log directory. Logging can be disabled to save disk space or prevent malware scanners from slowing down the system - in particular, when a lot of spots is being received (e.g. via RBN). Manually entered spots are still being logged to the .dxc file.
The displayed information is selectable (local time as a sun symbol, time spotted, spot comments, beam heading, and the callsign of the spot sender):
A double click on a selected line will automatically switch the active radio to the spot frequency, and will grab the call and enter it in the callsign logging field. You just need to complete the QSO and press [Return].
QSX information (like QSX 7239) is parsed from the comment field of the spot and handled correctly, so that when you click on such a spot, the transceiver will switch to split mode, put VFO A on the RX frequency and VFO B on the TX frequency. QSX is indicated by an asterisk (*) character on the spotted callsign. Cross-band QSX frequencies are being ignored.
Additional shortcuts:
- [Ctrl] + Dbl click on a spot removes the spot from the Announcements window (without confirmation).
- [Alt] + Dbl click on a spot loads the spot frequency in the sub VFO of the active radio (if your radio supports it)
For more information regarding the setup of DX Cluster connections, please see Commands | DX Cluster
Clock
Windows | Clock
Opens (or closes) the clock window.
To set time in Win-Test, you don't need to change the computer time. You just need to adjust the computer clock in the local time, within the right time zone. Win-Test will compute the UTC time from this information.
The color of the time display changes in minutes 59 and 00, to prepare an operator changeover in a multi-op environment.
This window also displays sunrise and sunset times (SR and SS) according to your location. To catch your eye, the color of these times will change when you are within 30 minutes of sunrise or sunset times.
This window also displays your Locator (which is needed if you want that WT exactly compute SR/SS times as well as Bearings and distance to the correspondent) and the Win-Test operating mode, RUN or S/P, according to your operating needs. For details on this feature see also Menu:Tools Data_entry.
Just as a side note, WinXP allows you to synchronize your computer's clock time through the Internet. Please see more details on Microsoft's support pages (overview and details).
The font type and size, as well as the background and all the usual window colors can be changed through the context menu using a right mouse click on that window.
Contest Recorder
Windows | Contest Recorder
Opens (or closes) the Contest Recorder window.
Before recording, right click and select MP3 Configuration to set the recording parameters.
A right-click on the Recorder window provides help to the keyboard shortcuts.
Use right-click | Files Information to see information about recorded files, or to delete recorded files.
The recording is a standard MP3 file which can be played on any MP3 player. Win-Test actually saves timestamps in the MP3 files which allows for a quick navigation when run from withing Win-Test. Win-Test creates sequential files up to a specific size (690 MBytes by default) and then switches to a new file.
The Contest recorder is a powerful tool to check your copying abilities, verify notes you have made during the contest or let others listen to what was audible on your end of the QSO. The shortcut AltGr+Enter quickly lets you jump to a specific QSO recording and you can then use the fast forward and fast backward functions to play it over and again.
Please note that in some contests, modifying your log after the contest is against the rules. However, it is never prohibited to go back to your log after having received your UBN report from the contest sponsor and find out why you failed to copy something or assumed a QSO where it wasn't a prefect QSO.
In very fierce competitions like WRTC, teams must provide a complete recording of the whole contest (both receive and transmit audio) to their referee. To record the transmit signal can be tricky and may require additional hardware, as most radios do not supply the monitor signal on the audio output line.
Win-Test uses the "standard" MP3 tags.
Title : Contest name + Category mode + File number (starting at 000)
Artist : Callsign
Album : Station
Year : Contest year (1st QSO)
In order to play QSOs, the MP3 tags must match the settings in the current .wt4 file. Otherwise, the recorder will display the message "No record for station X", with X being the current station nummer.
SSB bargraph
Windows | SSB bargraph
Opens (or closes) the SSB bargraph window
This bargraph displays the audio level of the Win-Test's digital voice player (if used, of course). The appropriate level is the yellow part of this bargraph. The windows can be rotated by 90 degrees.
Close all Windows
Windows | Close all windows
Closes all windows except the log entry area in the left lower area.

