Difference between revisions of "Menu:Windows"
| Line 162: | Line 162: | ||
Finally, the entire Partner window content can be cleared by using the appropriate context menu item or by pressing '''<tt>Alt-Backspace</tt>'''. | Finally, the entire Partner window content can be cleared by using the appropriate context menu item or by pressing '''<tt>Alt-Backspace</tt>'''. | ||
| + | |||
| + | If you do not want the partner to be limited by band and mode, use the "No band/mode filtering" option in the context menu of the partner window. | ||
==Status== | ==Status== | ||
Revision as of 00:14, 16 September 2006
Menu:Windows
Most of the windows have a context menu which can be opened by right-clicking into the window.
All windows (except thy MMTTY window) can be dragged by holding them on the title bar or by using ctrl and the left mouse button.
Worked Gridsquares
Windows | Worked Gridsquares or Alt-L
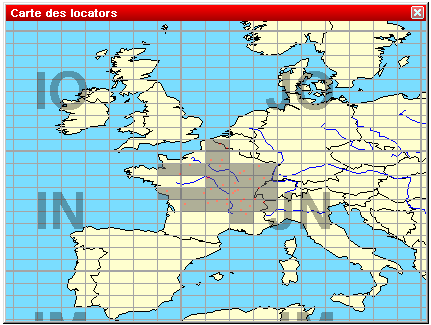
Opens (or closes) the gridsquares window. The gridsquares worked are in grey, and the red spots are the stations worked.
If the DX-Cluster Announcements window is opened and the gridsquare of a spot is known, passing the mouse over this spot will blink its location in this window.
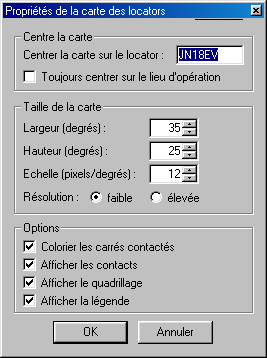
A click with the right mouse button allows to copy this window as an image to the clipboard, and to display (or not) some information about this map. At last, the "properties" menu will help you to modify several display parameters with the following dialog:
Worked Zones
Windows | Worked Zones or Alt-Z
Opens (or closes) the worked zones window. The title of this menu item will fit to the chosen contest.
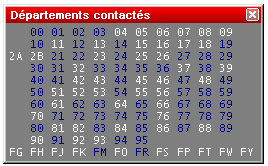
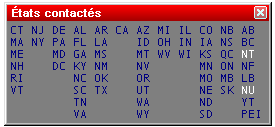
The window displays the worked multipliers (in blue) or not (in white) on the current band, and possibly the current mode.
Some examples:
Furthermore, with a right click on this window (if the contest is multi-bands and/or multi-modes) you can display the distribution of these multipliers by band (and/or mode).
At last, the same contextual menu allows you to copy all the datas of this window into the clipboard as an image or a text, and directly paste it as a text file or an Excel (TM) or OpenOffice spreadsheet.
Worked DXCC
Windows | Worked DXCC or Alt-M
Opens (or closes) the worked DXCC window. The title of this menu item will change with the contest chosen.
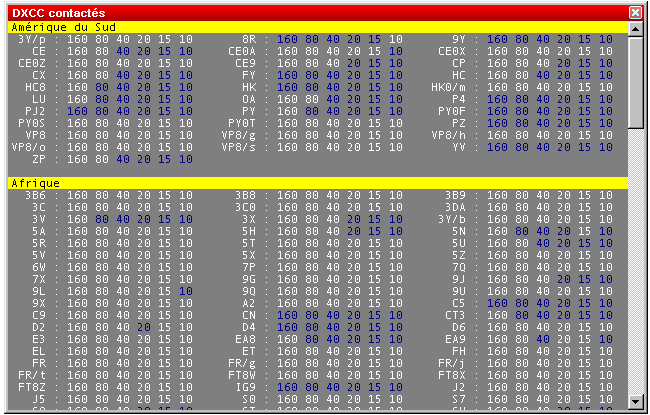
If one DXCC country has been worked on a band (possibly a mode), this band will be displayed in blue, otherwise it remains in white. This window is resizable.
A right click on this window allows to display the countries alphabetically sorted (within the same continent), or sorted by number of band/mode worked. More, to easily search for missing countries, the countries worked on all bands can be hidden (clean sweeps).
You can easily move to the next (or previous) bookmark - displayed on a yellow background by default - by holding the Shift key down, while rolling your mouse wheel.
Last, all the data included in this window can be copied as a text file, and pasted in text or directly in an Excel (TM) or OpenOffice spreadsheet, for a later analysis.
Check Callsign
Windows | Check Callsign or [F9]
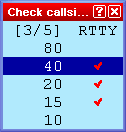
Opens (or closes) the worked callsign window. This window displays if
on which bands a specific callsign has been logged before. Depending
on the type of the contest, the display may have more than one column
to display the different possible modes.
Check Multipliers
Windows | Check Multipliers or [F10]
Opens (or closes) the checking multipliers window.
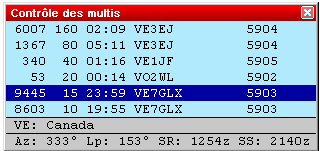
The deep blue line indicates the current QSO. The other lines indicate whether this multiplier has been worked or not on the other bands (and in the other modes if the contest rules permit). If this multiplier has been worked, Win-Test first seeks if the same station has been worked on the band. If not, another station in the same multiplier is displayed. CQWW DX display priority is: same callsign, same country and same zone, same country.
Furthermore, are specified:
- The official prefix and the name of the country
- Short and long path azimuts (Az and Lp)
- Sunrise and sunset times in this country (SR and SS)
A double click on a line will move the cursor to the specified QSO.
At last, with the contextual menu (right click on the window), you can set the refreshing trigger of this window: at each keypress in the logging field (automatic), or when the space bar is pressed. When automatic updating is activated, any modification in the received exchange field updates this window.
Search for Worked Multipliers
Windows | Search for Worked Multipliers or Shift-F10
Opens (or closes) the window of the worked multipliers.
To quickly verify whether a "zone" multiplier has been worked or not and on which bands, you just need to capture this "zone" in the callsign logging field and open this window (or press Shift-F10). All stations worked in this "zone", on each band, will be displayed.
Check Partials
Windows | Check Partials or [F12]
Opens (or closes) the checking partials window.
If this window is opened, and at least 3 characters captured in the callsign logging field, Win-Test looks in the master database for the callsigns including the mentionned string.
For example, in this upper screen-shot, the captured string is "A2Q". All the callsigns found by Win-Test show this string.
The white callsigns are those not worked yet. The green callsigns were worked, but on another band than the current one. The red callsigns are the dupes (callsigns already worked on the current band).
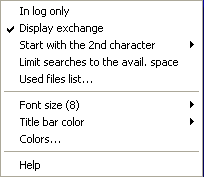
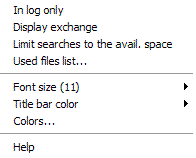
A right click in these windows brings up a menu where you can select, if you want to use the master database or just your log. Another option is (in some contests) if you want to see the expected report in that window. Then, for slow contests it might make sense to start the check partial function already after the second letter is entered into the callsign field. Finally, you may want to select that the number of callsigns displayed fits the available space.
Check N + 1
Windows | Check N + 1 or [F8]
Opens (or closes) the N + 1 window.
If this window is opened, and at least 3 characters captured in the callsign logging field, Win-Test looks in the master database for the callsigns differing from the mentionned string by one character.
This command also detects 2-character swap (dyslexia), as well as one missing character.
If the callsign is not included in the master database, and has not been worked yet, it is considered an UNIQUE. Otherwise, it is displayed in the first position.
The white callsigns are the stations not yet worked. The green ones are those worked on another band than the current one. The red, slanted ones are dupes.
A right click in these windows brings up a menu where you can select, if you want to use the master database or just your log. A second option is (in some contests) if you want to see the expected report in that window. Finally, you may wish to limit the number of callsigns displayed to the available space in the N+1 window.
Partner
Windows | Partner
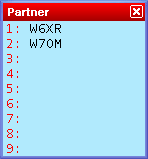
Opens (or closes) the partner window.
This feature is especially useful in a Multi-OP environment when facing large pile-ups and/or weak signals.
Situation: You got several callers coming back to your CQ. You pull out one callsign - but sometimes you are able to copy another callsign or at least parts of it. If you could remember this second call after the first QSO, you'd be able to call the second station right away (without QRZ) and save time.
Improvement: Set up a second operator (OP2), a second computer and a second pair of headphones, sometimes a second receiver. Both OPs now open up the Partner window on their computer. The running operator OP1 continues like before: He works the first callsign. In the mean time, the OP2 supports OP1 to copy the callsign - or alternatively - he can add callsigns he copied from the pile-up by entering the callsign on the QSO entry field and then pressing Alt-Enter.
This callsign will now be displayed on all computers in the network that are set at the same band and mode. OP1 will see the new callsign after his first QSO and calls that station right away.
The Partner window can hold up to 9 callsigns, and theses calls can be pulled into the callsign field with Alt-1, Alt-2...Alt-9. Usually this is done by OP1 to log that callsign, while OP2 uses this function remove the call from the partner window. Once the QSO is logged, that callsign will disappear from both partner windows.
You can also swap the callsign field with one of the entries by pressing Ctrl-1, Ctrl-2...Ctrl-9.
When a QSO is logged locally or via the network it is checked against the contents of the partner window, and - if found - removed from the partner window as it is now obsolete.
If automatic exchange guessing is enabled, a callsign grabbed from the partner window will have the exchange window filled in and will update the check partials and N+1 windows.
Finally, the entire Partner window content can be cleared by using the appropriate context menu item or by pressing Alt-Backspace.
If you do not want the partner to be limited by band and mode, use the "No band/mode filtering" option in the context menu of the partner window.
Status
Windows | Status or Alt-J
Opens (or closes) the status window.
This window indicates the status of each station connected to the network. From left to right, are displayed :
- Station name
- Current band and mode
- Station type
- QSY frequency of the current band and mode
- Radio 1 frequency
- Radio 2 frequency
- Time left before a possible QSY, according to the 10 minutes M/S rule, or "OK" if the station is allowed to make a QSY on another band. Note that this column only appears if the contest specifies this particular rule.
Your own station is displayed in a deep blue background. The active radio of each station has its frequency in red characters.
A double left click on a station name will display the chat dialog with this station name as default destination.
Opening the context menu with a right mouseclick will allow you to turn on network traffic logging. This might be useful for basic network troubleshooting. Tis log file uses the .ntk (stands for NeTworK) file extension.
At last, a double left click on any frequency displayed will tune the current radio on that frequency.
Skeds
Windows | Skeds or Alt-B
Opens (or closes) the skeds window.
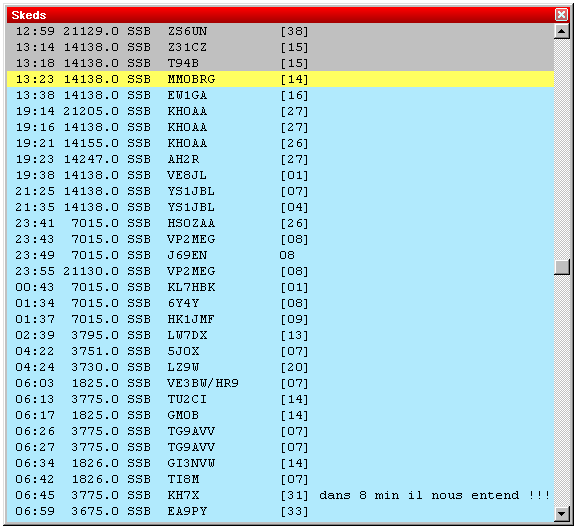
The skeds taken or the passed stations are displayed in this window.
- A grey background means that the sked is over for more than 10 minutes.
- A yellow background means that the sked is planned within less than 10 minutes maximum (a "hot sked"). If the window was not open, it will pop-up to remind the operator of the hot sked. The pop-up will be suppressed, however, if Win-Test is running minimized.
- A green background means that the sked is planned in more than 10 minutes.
A - (minus) sign before the hour means that the sked is over for more than 24 hours. A + (plus) sign before the hour means that the sked is planned in more than 24 hours.
A right click allows to sort the skeds window by time or by band. You can also hide the older skeds, and modify or cancel a sked. In a multi operating configuration, the sked data are sent across the network.
At last, note that a double left click will tune the current radio on the sked frequency and capture the callsign of the scheduled station in the callsign logging field. You will thus just need to press [Return] after completing the QSO!
Solar Activity
Windows | Solar Activity
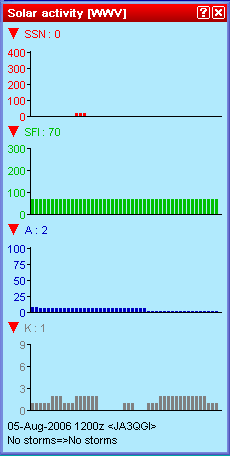
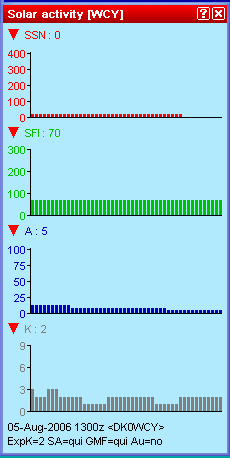
This option displays solar activity data that has been received from the DX cluster connection. You can chose between SSN, SFI, K and A indexes. It is an interesting tool to discover trends in propagation during a contest.
As there are two sources on the DX cluster for this kind of information, you may chose between WWV and WCY. This information can also be applied - in conjunction with HamCap - for specific propagation forecasts. See Menu Options HamCAP in this manual.
Click on the triangles to open or close a chart. You may open or close all charts at once by holding the [Shift] key down while clicking on one of the triangles.
QSY Wizard
Windows | QSY Wizard
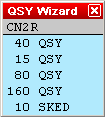
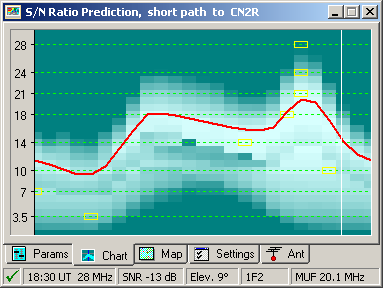
The QSY Wizard can only be used if HamCAP is installed and running as well. After working a DX, pressing ctrl-P will bring up the HamCAP window with a propagation prediction to this DX. Then the QSY Wizard will display the bands on which to which a QSY or sked may be useful:
In the above example CN2R has been worked on 20m. After pressing ctrl-P the wizard tells us that a QSY may be promising to 15, 40, 80 and 160m. For 10m, however, the wizard recommends a sked at 18:30 UT instead. This is the peak time predicted by HamCap for this path but MUF will be only be 20.1 MHz (the mouse cursor was over the 18:30/28MHz yellow square while creating this screenshot).
Summary
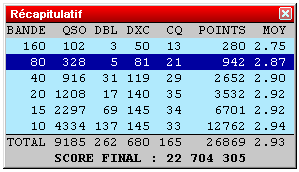
Windows | Summary or Alt-S
Opens (or closes) the scoring summary window.
The displayed number of QSO does not include the dupes. Thus, the QSO column displays only the QSO that have generated points.
A right click allows to copy the scoring summary datas in the clipboard, as an image, or as a text file (in WT language or in English, depending on the contest).
Rate
Windows | Summary or Alt-R
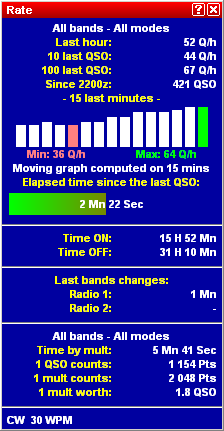
Opens (or closes) the rate window.
This window is divided in different parts:
The upper part displays the rate of the last hour, of the last 10 QSO, and of the last 100 QSO. More, it also displays a moving graph of the rate, computed on the last 15 minutes before the current QSO.
A right click allows to choose on what bands and modes these calculations must be done :
- All : No filtering is done
- Current : Filters only QSO done in the mode and band of the current radio
- According to QSO : Filters only QSO done in the mode and band of the current QSO
You can also choose to display the calculations as :
- QSO / h : Only based on the number of QSO
- Points / QSO : Averages the points of the QSO
- Points QSO / h : Without the multipliers
- Points / h : Including the multipliers
The graph is calculated on the last 15 minutes (default). Each bar, thus representing one minute on the air, calculates the moving average rate on the last X minutes, this time being selectable between 5 to 30 minutes. A short period will be selected for a contest with high rates (international HF, such as CQWW or WPX), and a longer one for a contest with slower rates (such as a national HF, or a VHF).
The next part gives information about Time ON and Time OFF. This calculation is based on a treshold, configurable from 1 to 120 minutes. The default is 10 minutes. If You are participating a contest that depends on larger offtimes, the tresholds can be set here.
Also the timeframe of the Alarm bar is settable here. It is the green horizontal bar showing 2 Mn 22sec in the screenshot above. It will get the more red, the more it reaches the right end of the scale. Default is 5 minutes, but it is configurable between 1 and 120 minutes.
The next part shows informations about band changes.
The central part gives general informations about the point statistics of the contest, e.g. time by mult, QSO counts, Mult worth, etc.
The lower part indicates the current mode and, in CW, the current speed, as well as the activation (or nor) of the automatic CQ repeat mode.
Finally, it is possible - with the same right click - to copy this window as an image in the Windows clipboard.
Note: the available menu entries of the context menu may vary on where you have right clicked into the rate window.
Statistics
Windows | Statistics or ctrl-F9
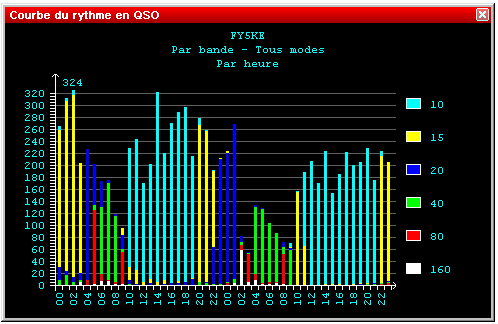
Opens (or closes) the rate sheet window.
The dimensions of this window can be changed. It displays the number of completed QSO, hour by hour, during the contest.
A right click allows to set different display options :
Band
- All (total) : Single color display of all the QSO on all the bands
- All (detailed) : Displays all the QSO with a color by band
- Current : Displays only QSO of the current band
- According to QSO : Displays only QSO for the band of the currently selected QSO
Mode
- All (total) : Single color display of all the QSO on all the modes
- All (detailed) : Displays all the QSO with a color by mode
- Current : Displays only QSO of the current mode
- According to QSO : Displays only QSO for the mode of the currently selected QSO
Display
- By time : Displays the QSO hour by hour
- Overall : Displays the progressive number of QSO hour by hour
Finally, it is possible - with the same right click - to copy this window as an image or as text in the Windows clipboard. You can then copy it in a text document or even in an Excel (R) or OpenOffice spreadsheet
TODO: describe statistic context menu (v3)
Gab
Windows | Gab or Alt-I
Opens (or closes) the gab window.
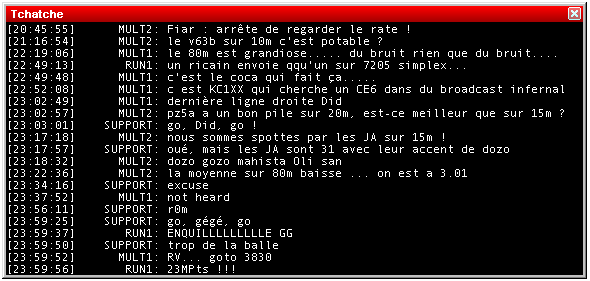
All the gab chat is displayed in this window. With a right click, you can choose to display (or not) the time when the message was sent, including (or not) the seconds. Moreover, this window can be copied as an image.
In the context menu, the option "Taskbar flashing" can be selected to make the Windows Task Bar flash every time a gab is received.
All the gab chat is recorded in the .gab file of the current contest.
A double-click in a station name in this window will open the chat dialog, with this station name as default destination.
World Map
Windows | World Map
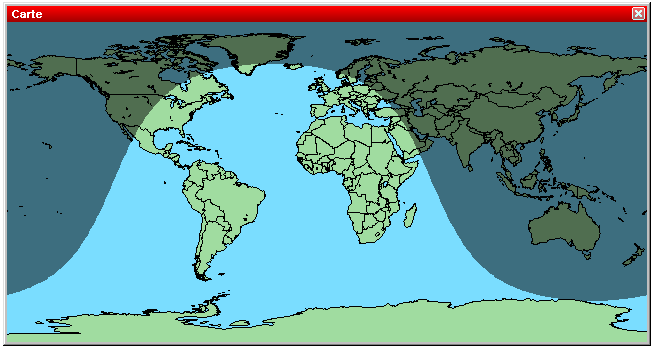
Opens (or closes) the map window
The dimensions of this worldmap window can be modified. With a right click, you can display (or not) the grey-line. Moreover, you can increase or decrease the format (zoom).
Radio 1, Radio 2
Windows | Radio 1 or Windows | Radio 2
Opens (or closes) the radio window.
These resizable windows are also called Band Maps.
The frequencies of the 2 VFO are displayed. The active VFO has a yellow background.
If Win-Test has a DX cluster connection, the bandmaps are automatically fed. The green callsigns are the new multipliers, the black ones are the new callsigns (not worked so far), and the dupes are in grey.
A double click on a callsign will automatically tune the radio on the spot frequency, and capture the callsign in the logging field. You just need to complete the QSO and press Return !
Furthermore, a right click on this window allows to change the scale of the bandmap display. While the VFO is set on the spot frequency, you can also display the callsign of the spotter and his potential comment.
At last, the Properties menu allows to define the spots life time, to delete - or not - the logging field if you enter a callsign by yourself (Ctrl-Enter), and to automatically fill - or not - the fields when you grab a spot in the bandmap (double click), and the spot bandwidth, for each mode (CW, SSB, RTTY), to determine when two spots are on different or on the same frequency. The spot bandwith can be set, between 200Hz and 5000Hz, in 200Hz steps.
Secondary Radio
Windows | Secondary Radio
Opens (or closes) the Secondary Radio window.
TODO I think this window controls the "other" radio currently not in use. Somebody has to find out and document this.
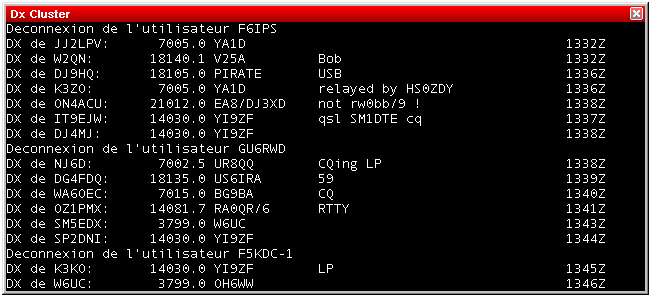
DX-Cluster Monitor
Windows | DX-Cluster monitor or Alt-O
Opens (or closes) the DX Cluster monitoring window.
DX-Cluster Announcements
Windows | DX-Cluster Announcements or Alt-A
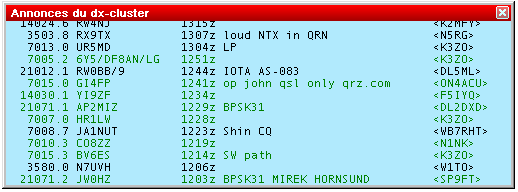
Opens (or closes) the DX cluster announcements window.
This window gathers all the spots coming from the DX cluster. The new multiplier callsigns are green, the non-multiplier callsigns (but not dupes) are black.
Optionnaly, with a right click, you can filter only the multipliers, and/or the current band. All the displayed informations are selectable (time, sender, comments).
A double click on a selected line will automatically switch the radio to the right frequency (if any connected of course), and will grab the call and enter it in the callsign logging field. You just need to complete the QSO and press [Return]!
Clock
Windows | Clock
Opens (or closes) the clock window.
To set time in Win-Test, you don't need to change the computer time. You just need to adjust the computer clock in the local time, within the right time zone. Win-Test will compute the UTC time from these datas.
The color of the time display changes in minutes 59 and 00, to prepare an operator change over in a multi operating context.
This window also displays sunrise and sunset times (SR and SS) according to your location. To catch your eye, the color of this window will change when you are within 30 minutes of sunrrise or sunset times.
SSB bargraph
Windows | SSB bargraph
Opens (or closes) the SSB bargraph window
This bargraph displays the audio level of the Win-Test's digital voice player (if used, of course). The appropriate level is the yellow part of this bargraph.
Close all Windows
Windows | Close all windows
Closes all windows except the log entry area in the left lower area.
