Menu:Windows
Menu:Windows
Most of the windows have a context menu which can be opened by right-clicking into the window.
All windows (except the MMTTY window) can be dragged by holding them on the title bar or by using Ctrl and the left mouse button.
Worked Gridsquares
Windows | Worked Gridsquares or Alt-L
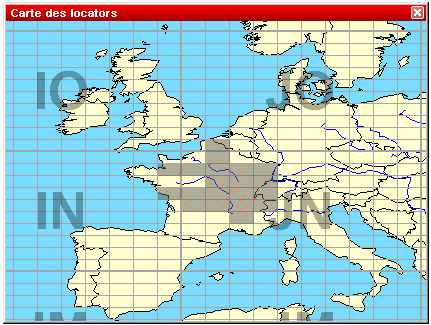
Opens (or closes) the gridsquares window. The gridsquares worked are in grey, the red spots are the stations worked and the green spots are the stations spotted. The current gridsquare is displayed in red color to give an indication of direction. This works even with only four of the six characters entered.
If the DX-Cluster Announcements window is opened and the gridsquare of a spot is known, passing the mouse over this spot will blink its location in this window.
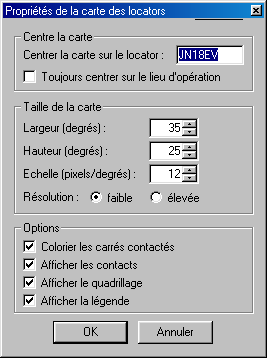
A click with the right mouse button allows to copy this window as an image to the clipboard, and to display (or not) some information about this map. At last, the "properties" menu will help you to modify several display parameters with the following dialog:
Worked Zones
Windows | Worked Zones or Alt-Z
Opens (or closes) the worked zones window. The title of this menu item will fit to the chosen contest.
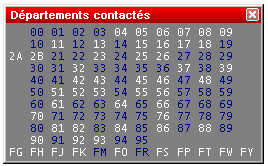
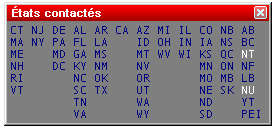
The window displays the worked multipliers (in blue) or not (in white) on the current band, and possibly the current mode.
Some examples:
Furthermore, with a right click on this window (if the contest is multi-bands and/or multi-modes) you can display the distribution of these multipliers by band (and/or mode).
At last, the same contextual menu allows you to copy all the datas of this window into the clipboard as an image or a text, and directly paste it as a text file or an Excel (TM) or OpenOffice spreadsheet.
Worked DXCC
Windows | Worked DXCC or Alt-M
Opens (or closes) the worked DXCC window. The title of this menu item will change with the contest chosen.
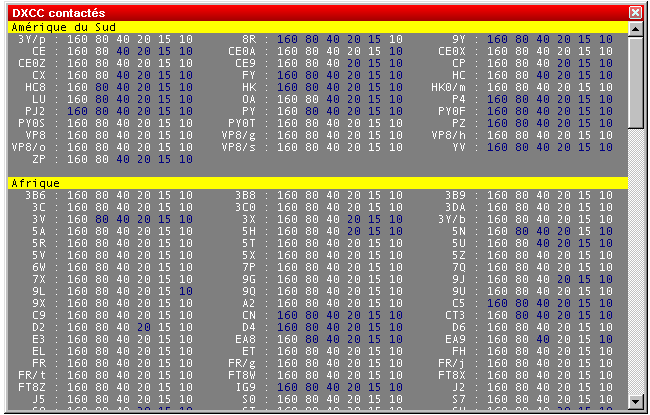
If one DXCC country has been worked on a band (possibly a mode), this band will be displayed in blue, otherwise it remains in white. This window is resizable.
A right click on this window allows to display the countries alphabetically sorted (within the same continent), or sorted by number of band/mode worked. More, to easily search for missing countries, the countries worked on all bands can be hidden (clean sweeps).
You can easily move to the next (or previous) bookmark - displayed on a yellow background by default - by holding the Shift key down, while rolling your mouse wheel.
Last, all the data included in this window can be copied as a text file, and pasted in text or directly in an Excel (TM) or OpenOffice spreadsheet, for a later analysis.
Check Callsign
Windows | Check Callsign or [F9]
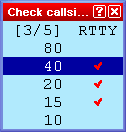
Opens (or closes) the worked callsign window. This window displays a checkmark if and on which bands a specific callsign has been logged before. Depending on the type of the contest, the display may show more than one column to display the different possible modes.
Moving the mouse cursor over the checkmark will bring up additional information about this QSO. And a double-click on it will move the cursor to this QSO.
Check Multipliers
Windows | Check Multipliers or [F10]
Opens (or closes) the checking multipliers window.
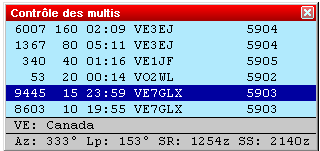
The deep blue line indicates the current QSO. The other lines indicate whether this multiplier has been worked or not on the other bands (and in the other modes if the contest rules permit). If this multiplier has been worked, Win-Test first seeks if the same station has been worked on the band. If not, another station in the same multiplier is displayed. CQWW DX display priority is: same callsign, same country and same zone, same country.
Furthermore, are specified:
- The official prefix and the name of the country
- Short and long path azimuts (Az and Lp)
- Sunrise and sunset times in this country (SR and SS)
A double click on a line will move the cursor to the specified QSO.
At last, with the contextual menu (right click on the window), you can set the refreshing trigger of this window: at each keypress in the logging field (automatic), or when the space bar is pressed. When automatic updating is activated, any modification in the received exchange field updates this window.
Search for Worked Multipliers
Windows | Search for Worked Multipliers or Shift-F10
Opens (or closes) the window of the worked multipliers.
To quickly verify whether a "zone" multiplier has been worked or not and on which bands, you just need to capture this "zone" in the callsign logging field and open this window (or press Shift-F10). All stations worked in this "zone", on each band, will be displayed.
Check Partials
Windows | Check Partials or [F12]
Opens (or closes) the checking partials window.
If this window is opened, and at least 3 characters captured in the callsign logging field, Win-Test looks in the master database for the callsigns including the mentionned string.
For example, in this upper screen-shot, the captured string is "A2Q". All the callsigns found by Win-Test show this string.
The white callsigns are those not worked yet. The green callsigns were worked, but on another band than the current one. The red callsigns are the dupes (callsigns already worked on the current band).
A double click on a callsign puts it into the callsign field.
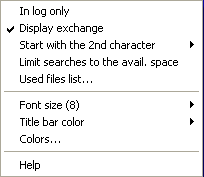
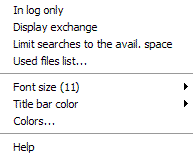
A right click in these windows brings up a menu where you can select, if you want to use the master database or just your log. Another option is (in some contests) if you want to see the expected report in that window. Then, for slow contests it might make sense to start the check partial function already after the second letter is entered into the callsign field.
Another option allows you limit the number of callsigns displayed to fit the available space in the window.
Finally, the option "Used files list" will display the files that Win-Test has loaded to feed the Check Partials windows.
Check N + 1
Windows | Check N + 1 or [F8]
Opens (or closes) the N + 1 window.
If this window is opened, and at least 3 characters captured in the callsign logging field, Win-Test looks in the master database for the callsigns differing from the mentionned string by one character.
This command also detects 2-character swap (dyslexia), as well as one missing character.
If the callsign is not included in the master database, and has not been worked yet, it is considered an UNIQUE. Otherwise, it is displayed in the first position.
The white callsigns are the stations not yet worked. The green ones are those worked on another band than the current one. The red, slanted ones are dupes.
A double click on a callsign puts it into the callsign field.
A right click in these windows brings up a menu where you can select, if you want to use the master database or just your log. A second option is (in some contests) if you want to see the expected report in that window. Finally, you may wish to limit the number of callsigns displayed to the available space in the N+1 window.
Partner
Windows | Partner
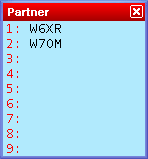
Opens (or closes) the partner window.
This feature is especially useful in a Multi-OP environment when facing large pile-ups and/or weak signals or when you are training a new operator.
Situation: You get several callers coming back to your CQ. You pull out one callsign - but sometimes you are able to copy another callsign or at least parts of it. If you could remember this second call after the first QSO, you'd be able to call the second station right away (without QRZ) and save time.
Improvement: Set up a second operator (OP2), a second computer and a second pair of headphones, sometimes a second receiver. Both OPs now open up the Partner window on their computer. The running operator OP1 continues like before: He works the first callsign. In the mean time, the OP2 supports OP1 to copy the callsign - or alternatively - he can add callsigns he copied from the pile-up by entering the callsign on the QSO entry field and then pressing Alt-Enter.
This callsign will now be displayed on all computers in the network that are set at the same band and mode. OP1 will see the new callsign after his first QSO and calls that station right away.
The Partner window can hold up to 9 callsigns, and theses calls can be pulled into the callsign field with Alt-1, Alt-2...Alt-9. Usually this is done by OP1 to log that callsign, while OP2 uses this function to remove the call from the partner window. Once the QSO is logged, that callsign will disappear from both partner windows.
You can also swap the callsign field with one of the entries by pressing Ctrl-1, Ctrl-2...Ctrl-9.
When a QSO is logged locally or via the network it is checked against the contents of the partner window, and - if found - removed from the partner window as it is now obsolete.
If automatic exchange guessing is enabled, a callsign grabbed from the partner window will have the exchange window filled in and will update the check partials and N+1 windows.
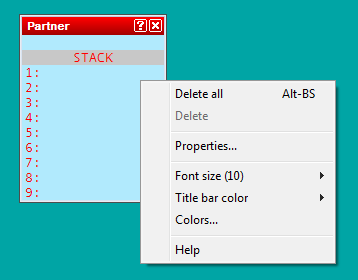
Finally, the entire Partner window content can be cleared by using the appropriate context menu item or by pressing Alt-Backspace.
Up to three support partners can be engaged. If you do not want the partner to be limited by band and mode, use the "No band/mode filtering" option in the context menu of the partner window.
A real-time mode is available in the partner window's context menu. This allows the main operator to have a real-time view on what the partner(s) is(are) typing (character by character) so he(she) does not have to wait until they press Alt-Enter in this time-critical situation. For this to work, the supporting partner has to change his station type to "Support" (see section Menu:Commands#Station_Type), indicated by R+ on the QSO entry line.
In the context menu of the partner window there are two setting that can be done, when more then one partner (up to 3) is engaged:
- as support, must be selected to which slot this partner will send its real-time characters
- as runner, must be selected how many slot are being displayed at the partner window top
The runner will then grab a real-time slot with Alt-Space, or in all cases, he can also double-click on any callsign of this window.
Status
Windows | Status or Alt-J
Opens (or closes) the status window.
This window indicates the status of each station connected to the network. From left to right, are displayed :
- Station name
- Current band and mode
- Station type
- QSY frequency of the current band and mode
- Radio 1 frequency
- Radio 2 frequency
- Time left before a possible QSY, according to the 10 minutes M/S rule, or "OK" if the station is allowed to make a QSY on another band. Note that this column only appears if the contest specifies this particular rule.
Your own station is displayed in a deep blue background. The active radio of each station has its frequency in red characters. The list may be by band and station names when it gets cluttered in a very large network by using the appropriate function in the context menu.
A double left click on a station name will display the chat dialog with this station name as default destination.
Opening the context menu with a right mouseclick will allow you to turn on network traffic logging. This might be useful for basic network troubleshooting. This log file uses the .ntk (stands for NeTworK) file extension.
At last, a double left click on any frequency displayed will tune the current radio to that frequency.
Skeds
Windows | Skeds or Alt-B
Opens (or closes) the skeds window.
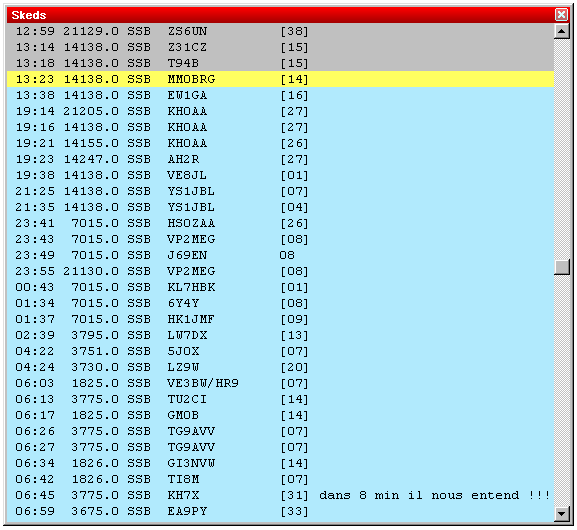
The skeds taken or the passed stations are displayed in this window.
- A grey background means that the sked is over for more than 10 minutes.
- A yellow background means that the sked is planned within less than 10 minutes maximum (a "hot sked"). If the window was not open, it will pop-up to remind the operator of the hot sked. The pop-up will be suppressed, however, if Win-Test is running minimized.
- A green background means that the sked is planned in more than 10 minutes.
A - (minus) sign before the hour means that the sked is over for more than 24 hours. A + (plus) sign before the hour means that the sked is planned in more than 24 hours.
A right click allows to sort the skeds window by time or by band. You can also hide the older skeds, and modify or cancel a sked. In a multi operating configuration, the sked data are sent across the network.
At last, note that a double left click will tune the current radio on the sked frequency and capture the callsign of the scheduled station in the callsign logging field. You will thus just need to press [Return] after completing the QSO!
Solar Activity
Windows | Solar Activity
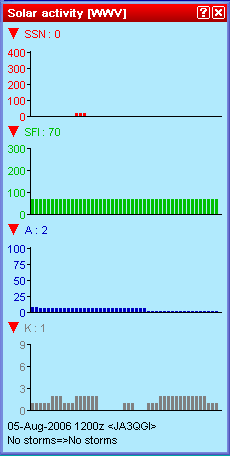
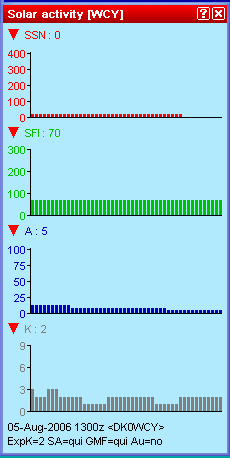
This option displays solar activity data that has been received from the DX cluster connection. You can chose between SSN, SFI, K and A indexes. It is an interesting tool to discover trends in propagation during a contest.
As there are two sources on the DX cluster for this kind of information, you may chose between WWV and WCY. This information can also be applied - in conjunction with HamCap - for specific propagation forecasts. See Menu Options HamCAP in this manual.
Click on the triangles to open or close a chart. You may open or close all charts at once by holding the [Shift] key down while clicking on one of the triangles.
QSY Wizard
Windows | QSY Wizard
The QSY Wizard can only be used if HamCAP is installed and running as well. You must also have the charts tab selected in the Options | HamCAP | Tab menu.
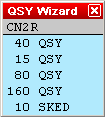
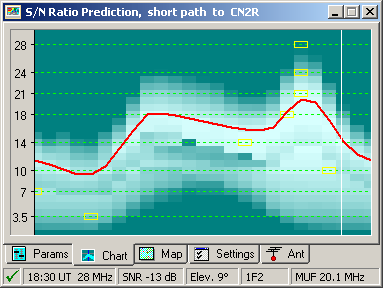
After working a DX, pressing Ctrl-P will bring up the HamCAP window with a propagation prediction to this DX. Then, the QSY Wizard will display the bands on which to which a QSY or sked may be useful:
In the above example CN2R has been worked on 20m. After pressing Ctrl-P the wizard tells us that a QSY may be promising to 15, 40, 80 and 160m. For 10m, however, the wizard recommends a sked at 18:30 UT instead. This is the peak time predicted by HamCap for this path but MUF will be only be 20.1 MHz (the mouse cursor was over the 18:30/28MHz yellow square while creating this screenshot).
Extra Information
This window displays data included in .XDT (eXtra DaTa) files. These files are textual and have a very basic syntax. These files are suitable for name lists (your favorite contest friends or club members, whose names you never get to remember in the middle of the contest) or information about a station's capabilities on other VHF/UHF/SHF bands so that you will want to ask for a sked.
XDT Files
The first column is the callsign of the station for which information is to be displayed. The rest of the line carries the information to display. There can be only one entry per callsign. Lines have to be formatted in MS-DOS mode, i.e. CR/LF at the end.
You can set up to 10 default extra data files by the menu function Options | Data files | Default data files. These files will be opened with every log. They must be located in the WT installation directory. Refer to Menu: Options Default extra data files... for detailed information.
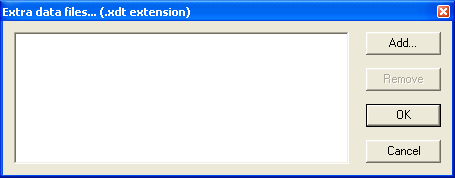
You can also add log-specific extra data files by using the Extra files... item in the context menu of this window (right-click to open the contextual menu). A new window will open-up where you can click the ADD button to browse the computer resources to locate and select the file you need (see picture).
There is no limitation to the location and the number of these log-specific files. The added file names and paths will then be save in a file with .xdl extension among all the other contest specific files (.LOG, .SUM, .pkt, .agb, .wtb, etc.).
If you modify an .XDT file while it is in use, you must reload it by using the Reload files item in the context menu.
Note: This function is tailored to deal with few thousands of callsigns only. Don't try it with millions of lines!
Directives
Directives are special statements in the data file beginning with a hash sign and a space.
The # TITLE directive is used to display a title in the window, like this:
# TITLE Operator Names
CT1BOH Jose
DJ1YFK Fab
DL4NER Werner
DL6RAI Ben
F5HRY Herve
F5MZN Olivier
F6FVY Larry
M0CLW Simon
M3PHP Peter
The # VARIABLE directive allows you to send the extra information in a CW message by using a variable name. The variable name must begin with the $ character.
Example: The following line will substitute the $OPNAME string in the CW messages with the extra info included in this file, if the sent callsign has matching data.
# VARIABLE $OPNAME
Note: The variable subsitution only works with the internal CW keyer.
Summary
Windows | Summary or Alt-S
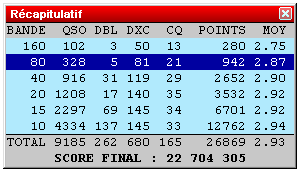
Opens (or closes) the scoring summary window.
The displayed number of QSO does not include the dupes. Thus, the QSO column displays only the QSO that have generated points.
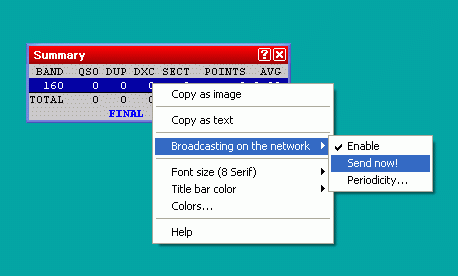
A right click allows to copy the scoring summary data in the clipboard as an image or as a text file (in WT language or in English, depending on the contest).
The context menu also allows you to configure and enable live score reporting by using a specific UDP broadcast protocol [1]. Please note that additional third-party software is needed to post your score to one of the live scoreboards on the internet.
For testing purposes, there is an option to create a live score broadcast "now"; typically, it will be broadcasted automatically once every five minutes or however you set up the periodicity. Live score broadcasting in a multi operator environment is limited to the station that is the network time master. For further information about live scores, please see [2] and [3].
Rate
Windows | Summary or Alt-R
Opens (or closes) the rate window.
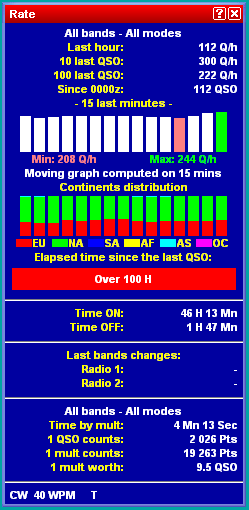
This window is divided in different parts:
The upper part displays the rate of the last hour, of the last 10 QSO, and of the last 100 QSO. It also displays a moving graph of the rate, computed on the last 15 minutes before the current QSO. The lower portion of that window deisplays additional rate information in text format.
Graphs
The graph is calculated on the last 15 minutes (default). Each bar, thus representing one minute on the air, calculates the moving average rate on the last X minutes, this time being selectable between 5 to 30 minutes. A short period will be selected for a contest with high rates (international HF, such as CQWW or WPX), and a longer one for a contest with slower rates (such as a national HF, or a VHF).
Below is a display that shows instant continent distribution of previous QSOs. It uses the same timing parameters as the instant rates above.
Text Information
The next part gives information about Time ON and Time OFF. This calculation is based on a treshold, configurable from 1 to 120 minutes. The default is 10 minutes. If You are participating a contest that depends on larger offtimes, the tresholds can be set here.
Also the timeframe of the Alarm bar is settable here. It is the green horizontal bar showing 2 Mn 22sec in the screenshot above. It will get the more red, the more it reaches the right end of the scale. Default is 5 minutes, but it is configurable between 1 and 120 minutes.
The next part shows informations about band changes.
The central part gives general information about the point statistics of the contest, e.g. time by mult, QSO counts, Mult worth, etc.
The lower part indicates the current mode and, in CW, the current speed, as well as the status of the automated CQ repeat mode.
Context Menu
A right click allows you to choose on what bands and modes these calculations have to be done:
- All : No filtering is done
- Current : Filters only QSO done in the mode and band of the current radio
- According to QSO : Filters only QSO done in the mode and band of the current QSO
You can also choose to display the calculations as :
- QSO / h : Only based on the number of QSO
- Points / QSO : Averages the points of the QSO
- Points QSO / h : Without the multipliers
- Points / h : Including the multipliers
Moreover, the display of this window can be customized by tagging different sections in the Display context menu:
- Instant rate moving graph
- Instant continents distribution
- Off-time timer
- Time ON / Time OFF
- Band Changes
- Band Changes elapsed times
- QSO/Mult ratio
- Distances Data
Finally, it is possible - with a right click of the mouse the same right click - to copy this window as an image in the Windows clipboard.
Note: the available menu entries of the context menu may vary on where you have right clicked into the rate window.
Statistics
Windows | Statistics or ctrl-F9
Opens (or closes) the rate sheet window.
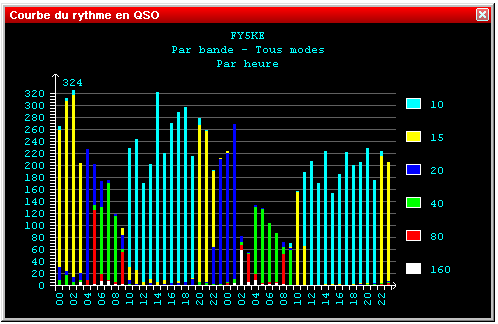
The size of this window can be changed by dragging. It displays the number of completed QSO, hour by hour, during the contest.
Time span is fixed depending on the contest type. For the smaller contest, the display is 24 hours wide; for the major contest it spans the full 48 hours; for DXpeditions it is 96 hours wide.
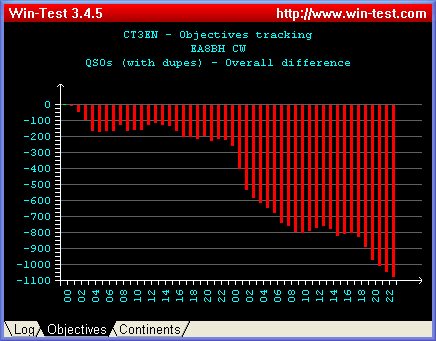
Switching to the Objectives tab in the statistics window, you may compare your current score to a pre-loaded prognosis, which may be derived from a previous contest operation or generated by hand. Positive offsets with respect to the objective file are shown in green color, negative offsets in red color.
Please see the Menu: Tools Load an objective file chapter, in this manual, for further information on creating/loading objective files.
A right click allows to set different display options:
Displayed Data
- Select which kind of data to display: QSOs, QSO points, multipliers, points, kilometers.
Band
- All (total): Single color display of all the QSO on all the bands
- All (detailed): Displays all the QSO with a color by band
- Current: Displays only QSO of the current band
- According to QSO: Displays only QSO for the band of the currently selected QSO
Mode
- All (total): Single color display of all the QSO on all the modes
- All (detailed): Displays all the QSO with a color by mode
- Current: Displays only QSO of the current mode
- According to QSO: Displays only QSO for the mode of the currently selected QSO
Display
- By time: Displays the QSO hour by hour
- Overall: Displays the progressive number of QSO hour by hour
Another option allows you to create or load an objective file directly from here.
Finally, it is possible to copy this window as an image or as text to the Windows clipboard. You can then copy it to a text document or even into an Excel (R) or OpenOffice spreadsheet.
Gab
Windows | Gab or Alt-I
Opens (or closes) the gab window.
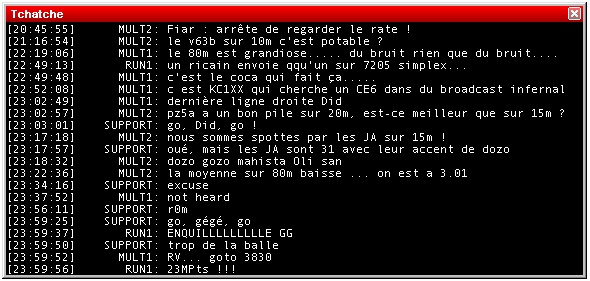
All the gab chat is displayed in this window. With a right click, you can choose to display (or not) the time when the message was sent, including (or not) the seconds. Moreover, this window can be copied as an image.
In the context menu, the option "Taskbar flashing" can be selected to make the Windows Task Bar flash every time a gab is received.
All the gab chat is recorded in the .gab file of the current contest.
A double-click in a station name in this window will open the chat dialog, with this station name as default destination.
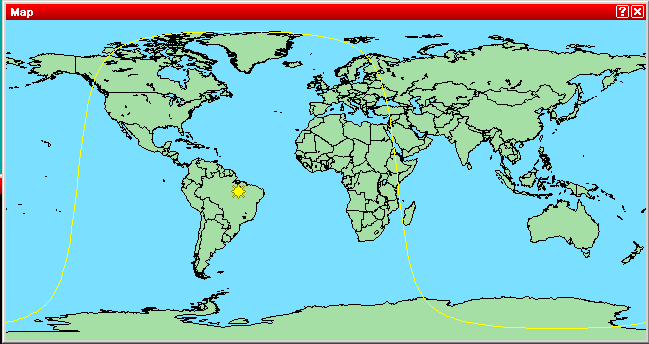
World Map
Windows | World Map
Opens (or closes) the map window
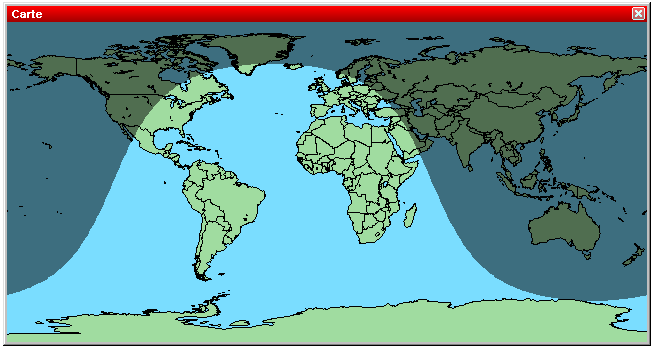
The dimensions of this worldmap window can be modified. With a right click, you can display (or not) the grey-line. Moreover, you can increase or decrease the format (zoom).
An additional option allows you to display only the greyline terminator plus a little symbol for the sun which makes reading the information a little easier at times.
Radio 1, Radio 2 (Band Maps)
Windows | Radio 1 or Windows | Radio 2
Opens (or closes) the radio window.
These resizable windows are also called Band Maps.
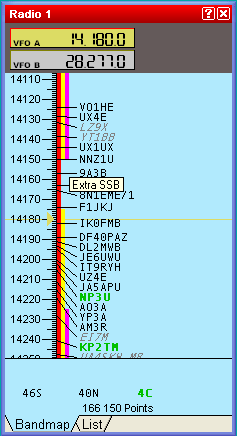
The frequencies of the 2 VFO are displayed. The active VFO has a yellow background.
If Win-Test has a DX cluster connection, the bandmaps are automatically fed from the DX cluster data stream, from logging contacts and by manually adding information using Ctrl-Enter instead of [Enter]. The green callsigns are the new multipliers, the black ones are the new callsigns (not worked so far), and the dupes are in grey and slanted font.
A double click on a callsign will automatically put the radio on the spot frequency and capture the callsign in the logging field. You just need to complete the QSO and press [Enter]!
While in split mode during 40 m and 80 m SSB operation, when adding a spot to the band map, it will remember both the settings of the RX and the TX VFO and will store these information properly so that when you'll come back to that spot, both VFOs will be set up correctly and you'll be ready to call in (unless the QSX frequency has changed in the mean time).
Moving the mouse cursor over the spot in the band map will bring up additional information about this spot, like callsign of the spotter, how old the spot is and any possible comments. Clicking the spot with the [ctrl] key removes the spot from the band map (without confirmation).
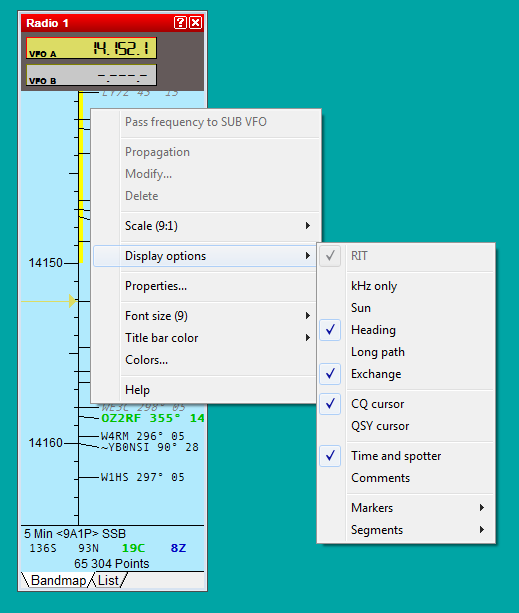
A right click on this window brings up it's context menu where you can change the scale of the bandmap display from 1:1 up to 12:1. The scale can also be set through the mouse wheel.
Special cursors
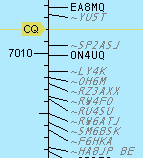
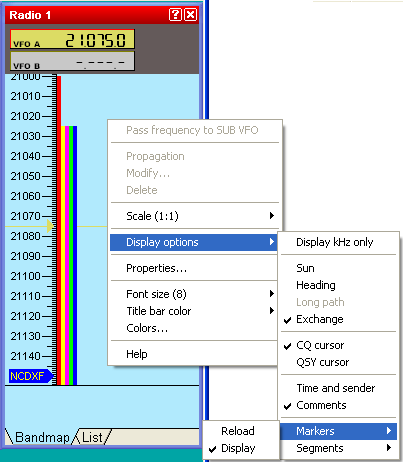
Special indicators for the last CQ frequency or the QSY frequency (set with the PASSFREQ text command, or with the Commands | QSY frequency menu option) can also be activated (see picture).
To enable them, tag the CQ cursor and/or the QSY cursor items in the Display Options submenu of the context menu itself.
Extended information
The Display Options menu also allows you to select if the expected exchange will be displayed in the band map and other minor details, like day/sunrise/sunset/night symbols, time and sender, comments etc.
Markers
The Display Options menu allows you to enable the displaying of markers. These can be useful for beacons and other known stations on the bands.
Markers are defined by text files with a .mkr extension located in the Win-Test directory. WT can use and display up to 10 files simultaneously; they can be selected in the Options | Data files | Markers files menu. For detailed information, please see Menu: Options Data files Markers files.
Marker display settings can be different for each radio. The syntax of the marker files is very basic and they are easy to create with a simple text editor like Notepad.
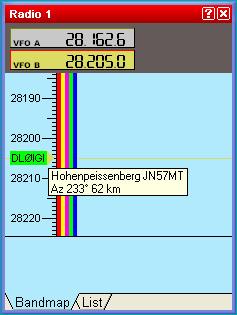
A marker is defined by its frequency (in kHz), a label (one word) and an optional tooltip (30 chars max.) that will flash when the mouse cursor is positioned on the marker for a few seconds. If you include a four or six character gridsquare locator, WT will display heading and distance to this gridsquare in the tooltip window.
Example:
  28205 DL0IGI Hohenpeissenberg JN57MT
  28257 DK0TEN Sipplinger Berg JN47NT
  28277.5 DF0AAB Kiel JO54GH
Two DIRECTIVES (or KEYWORDS) define the background and foreground color:
- # BACKGROUND color => Sets the background color of the following markers in the file. If no color is specified, the default color is green.
- # TEXT color => Sets the text color of the following markers in the file. If no color is specified, the default color is black.
The known colors are: White, Black, Red, Green, Blue, Yellow, Magenta, Cyan. The case of the color is irrelevant, so "green" and "Green" are identical.
Example :
  # BACKGROUND white
  # TEXT green
  #
  14100 Bcn NCDXF Beacon
This will display a white marker with a green text "Bcn". The associated tooltip will be "NCDXF Beacon". As usual, you can double-click on a marker to set the current radio on the frequency of the marker. A sample file NcdxfBeacons.mkr is located in the WT repository at: http://download.win-test.com/files/markers/. It displays markers for each NCDXF beacon.
You may build your own marker files (VHF beacons etc.) and share it with the WT community if you want.
Segments
WT can display band allocations for different license types in the bandmap tab of the radio windows. This allows you to select a run frequency which is in right band segment for US-Advanced or US-Novice amateurs for example.
Band segments are defined by text files with a .seg extension located in the Win-Test directory. WT can use and display up to 10 files simultaneously; they can be selected in the Options | Data files | Segments files menu. Please find more detailed information in Menu: Options Data files Segments files.
Due to space constraints - you can't have more than 5 segments displayed per band for any given frequency.
The segments display settings can be different for each radio.
The syntax of the segments files is very basic, and the files are easily created with a simple text editor like Notepad. A segment is defined by specifying its lowest and its highest frequency (in kHz). The two frequencies may be linked by an hyphen for easier reading. An optional tooltip text (30 chars max.) can be given to explain the meaning of the color segment. By placing the mouse cursor over a colored line in the band map display, the tooltip will display.
The BandMap segment color is indicated by the DIRECTIVE (keyword) COLOR like given below. The known colors are: White, Black, Red, Green, Blue, Yellow, Magenta, Cyan. The case of the color name is irrelevant. If no color is specified, the segments will be displayed in yellow.
Example:
  # COLOR Red
  14000-14150 Extra CW
  14150-14350 Extra SSB
  # COLOR Yellow
  14025-14150 Advanced CW
  14175-14350 Advanced SSB
  # COLOR Magenta
  14025-14150 General CW
  14225-14350 General SSB
This will display the US band allocation in the 20-m-band.
The segments order, and potential overlaps in the file are irrelevant. WT will take care to display them in an optimized way.
Two sample files are located in the WT repository at http://download.win-test.com/files/segments/
- UsSegmentsDetailled.seg displays all band segments for every US licence type.
- UsSegments.seg displays all band segments in which all US licencees are potentially active.
You may create your own band segments files for other countries, regions, etc. and share them with the WT community if you want.
Band Map properties
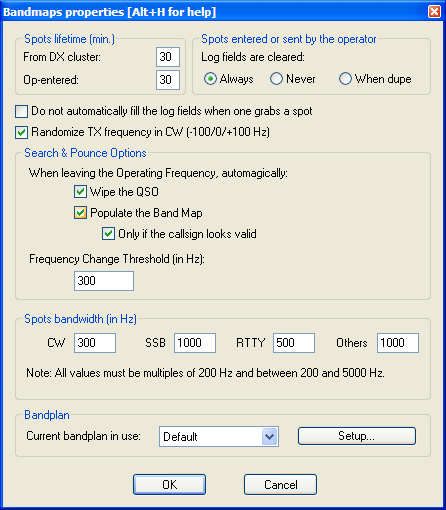
Selecting 'Properties...' in the context menu, a new Bandmaps properties window will open up.
There you can define the spots lifetime, to clear the logging field if you enter a callsign by yourself (Ctrl-Enter), and to automatically fill in the fields when you grab a spot in the bandmap (double click), and the spot bandwidth, for each mode (CW, SSB, RTTY), to determine when two spots are on different or on the same frequency. The spot bandwith can be set, between 200Hz and 5000Hz, in 200Hz steps. The lifetime of spots in the band map can be changed from the default (60 minutes) to any other value below 100 minutes. You may also specify different lifetimes for spots from the DX cluster and spots that were added by the operator (using Ctrl-Enter).
Search & Pounce Options allow you to add spots to the band map without having to press ctrl-[Enter] by selection the option "Populate the Band Map".
Secondary Radio
Windows | Secondary Radio
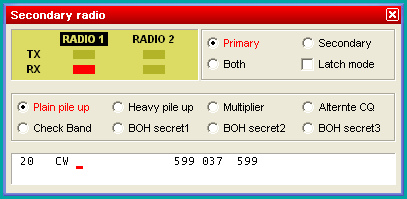
Opens (or closes) the Secondary Radio window.
This window controls the "other" radio that is currently not in use during SO2R operation, not necessarily radio 2. For more information, please see SO2R/Second_radio_window.
DX-Cluster Monitor
Windows | DX-Cluster monitor or Alt-O
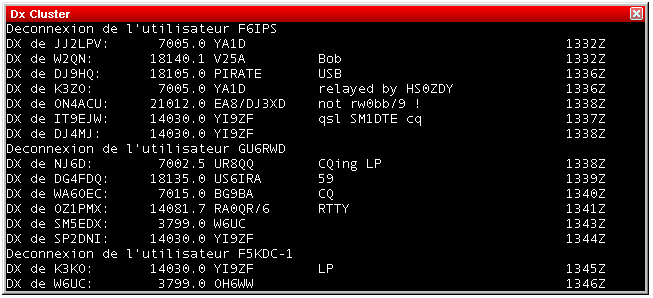
Opens (or closes) the DX Cluster monitoring window.
The contents of this window are logged to to the .pkt file. The window is scrollable so that you can step back through history, back - even to the beginning of the file. The scrolled window will not update when new spots arrive. However, there is a little hint in the title bar like [+1138 lines]. In order to see all spots which have arrived in the mean time you have to move the scrollbar back to the end of the window.
For more information regarding the setup of DX Cluster connections, please see Commands | DX Cluster
DX-Cluster Announcements
Windows | DX-Cluster Announcements or Alt-A
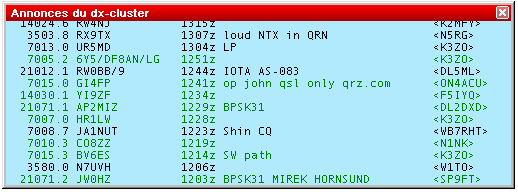
Opens (or closes) the DX cluster announcements window.
This window gathers all the spots coming from the DX cluster. The new multiplier callsigns are green, the non-multiplier callsigns (but not dupes) are black.
Optionally, with a right click, you can filter only the multipliers, and/or the current band. All the displayed informations are selectable (time, sender, comments).
A double click on a selected line will automatically switch the radio to the right frequency (if any connected of course), and will grab the call and enter it in the callsign logging field. You just need to complete the QSO and press [Return]!
QSX information (like QSX 7239) is parsed from the comment field of the spot and handled correctly, so that when you click on such a spot, the transceiver will switch to split mode, put VFO a on the RX frequency and VFO B on the TX frequency. QSX is indicated by an asterisk (*) character on the spotted callsign. Cross-band QSX frequencies are being ignored.
Clicking the spot with the [Ctrl] key removes the spot from the Announcements window (without confirmation).
For more information regarding the setup of DX Cluster connections, please see Commands | DX Cluster
Clock
Windows | Clock
Opens (or closes) the clock window.
To set time in Win-Test, you don't need to change the computer time. You just need to adjust the computer clock in the local time, within the right time zone. Win-Test will compute the UTC time from this information.
The color of the time display changes in minutes 59 and 00, to prepare an operator change over in a multi operating context.
This window also displays sunrise and sunset times (SR and SS) according to your location. To catch your eye, the color of this window will change when you are within 30 minutes of sunrrise or sunset times.
Just as a side note, WinXP allows you to synchronize your computer's clock time through the Internet. Please see more details on Microsoft's support pages (overview and details).
SSB bargraph
Windows | SSB bargraph
Opens (or closes) the SSB bargraph window
This bargraph displays the audio level of the Win-Test's digital voice player (if used, of course). The appropriate level is the yellow part of this bargraph.
Close all Windows
Windows | Close all windows
Closes all windows except the log entry area in the left lower area.
